
The RSI Indicator for Forex Traders
In our exploration of the relative strength index (RSI) for forex traders, it's essential to begin by delving into the oscillator family of indicators, which encompasses the RSI. Oscillators prove their worth in situations where discerning a definite price trend in an asset becomes challenging. This effectiveness arises from their capacity to anticipate the asset's high and low prices between two extreme points, relative to its moving average. By creating a trend indicator that oscillates within these boundary bands, analysts can better comprehend the asset's price dynamics, thus earning their title as oscillator indicators.
Through this clear demarcation of the limits, some oscillator indicators show the speed of directional changes (momentum) in the price of the asset – including currencies in forex trading. In this regard, a momentum indicator used in forex trading, for example, shows the rate at which the currency’s price either increases or decreases, thereby indicating the weakness or strength of the currency.
The relative strength index (RSI) falls into these two categories – it is an oscillator indicator that also happens to be a momentum indicator. In this article, we’ll explore the RSI indicator and its role in facilitating forex trading. We’ll also show you how to calculate the RSI and how you can use it when trading. We’ll also list a few benefits and limitations of RSI.
What is the RSI Indicator?
First introduced in his groundbreaking 1978 book titled “New Concepts in Technical Trading Systems,” the RSI indicator was the brainchild of J. Welles Wilder Jr., an American mechanical engineer turned real estate developer. The book considers the RSI as a tool that could add a novel dimension to chart interpretation when plotted in conjunction with a daily chart bar. These interpretations include: tops and bottoms, divergence, chart formations, failure swings, and support and resistance.
In developing the RSI concept, Welles based it upon the momentum oscillator concept, which had already been created. As stated, this concept measures the velocity of directional price movement. However, while the momentum oscillator concept was already known, it presented three main problems that inspired Welles to develop the RSI indicator. These included the need to store significant volumes of data, the scale to be used in the oscillator curve’s ‘Y’ axis (how high was high and how low was low), and, lastly, unpredictable and rapid price movements created erroneous figures.
By addressing these challenges, Welles came up with a concept that indicates whether the market was oversold or overbought. If the price goes up rapidly, the market reaches a point beyond which it is considered overbought. Likewise, if the price goes down rapidly, the market surpasses a threshold beyond which it is said to be oversold. In either case, a reversal follows, which a forex trader can take advantage of.
RSI Equation
Welles’ concept defines the relative strength index, which is calculated using the following equations:
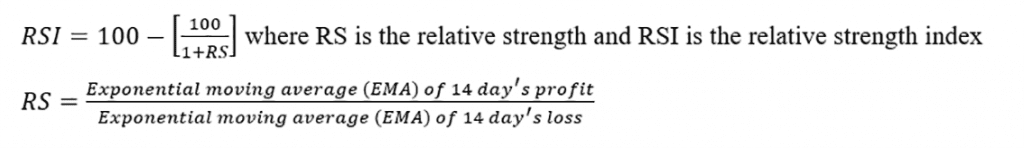
Importantly, knowledge of how to read a candlestick is a prerequisite when calculating the relative strength. This is because it is important to identify the closing and opening prices when the base currency to quote currency ratio either goes up or down. Typically, when the price goes down, the top bar of the candlestick indicates the open price, while the bottom bar shows the closing price. When the price goes up, the bottom bar shows the opening price, while the top one shows the closing price.
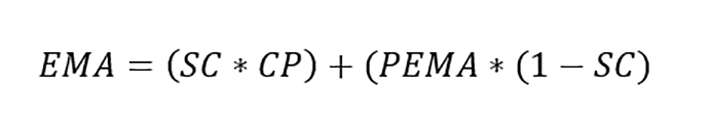
At the same time, it is also important to know how to calculate the EMA using the following equation:
 Where:
- EMA is the exponential moving average
- SC is the exponential smoothing constant, calculated by dividing 2 by the number of days in consideration (N) + 1 (
- CP is the current price
- PEMA is the previous period’s EMA
The smoothing constant (SC) filters out spikes that would have otherwise given a wrong idea of the price movement of a given currency pair. It accords more weight and significance to the most recent pricing data. In calculating the RS, the N in the SC equation is set as 14 days.
How to Trade using RSI Indicator
As we had mentioned earlier, the RSI is an oscillator indicator. This is because the RSI equation above generates a result within the range of zero to 100. As a result, if you were to plot a graph using the calculated RSI values for a given currency pair, the line would oscillate between zero and 100.
Keeping a journal of your trades using this indicator can be immensely helpful in learning from bad trades and steering yourself towards more steady returns.
What does RSI Indicator Signify?
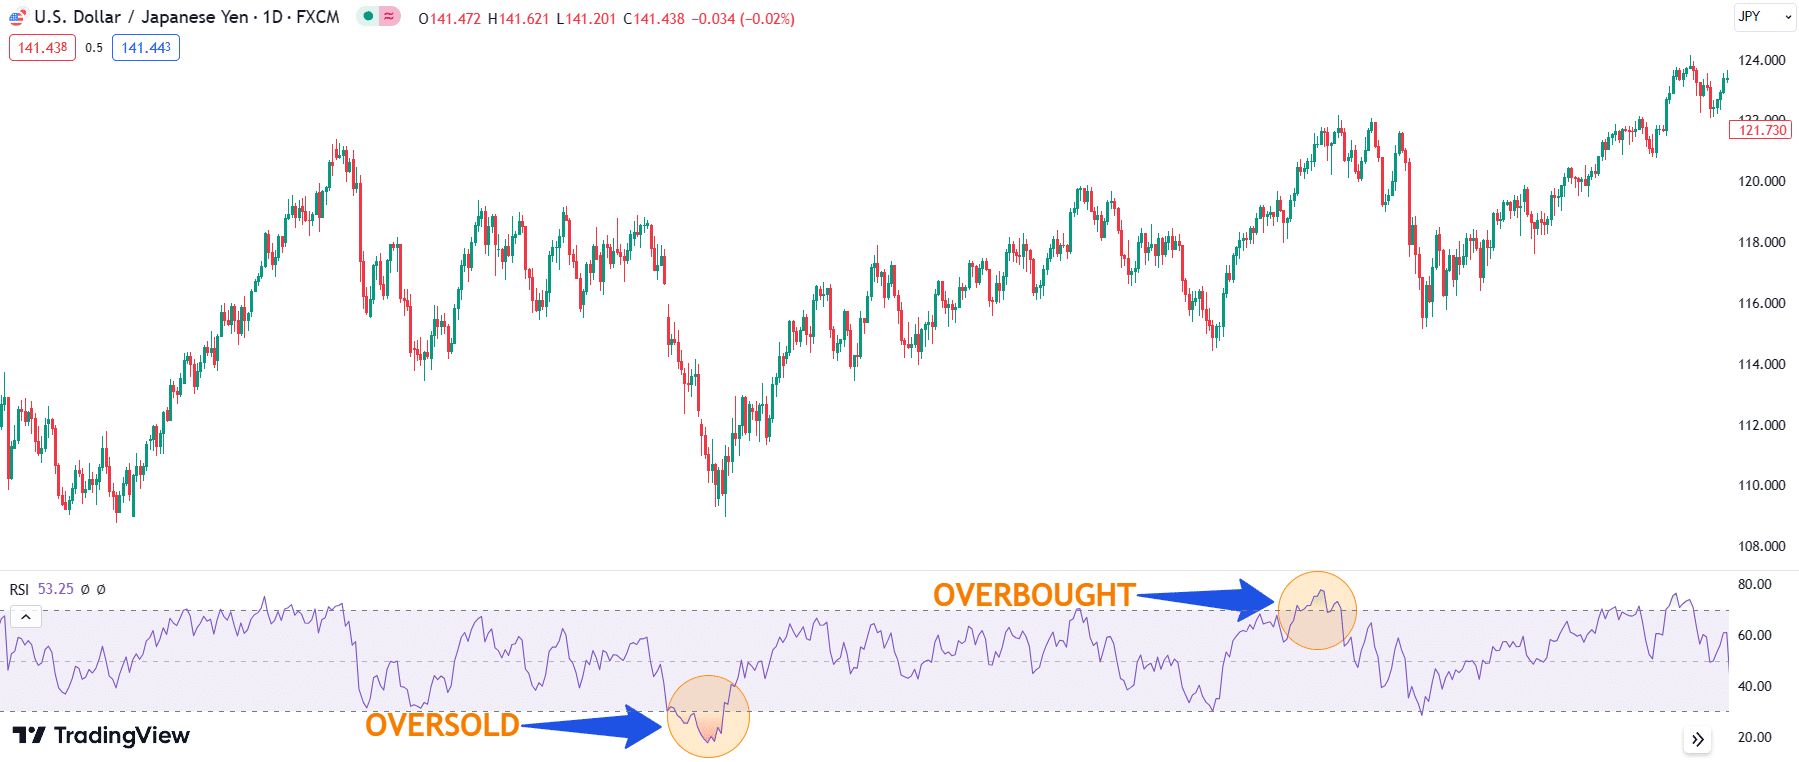
Every value generated by the RSI equation carries a distinct meaning that serves as a guiding principle in trading decisions. When these values are charted on a line graph, patterns begin to emerge. Specifically, once the line graph either touches or surpasses the 70 mark, or alternatively touches or falls below the 30 mark, a shift in its trajectory becomes evident.
An RSI value surpassing 70 signifies an overbought market condition. Consequently, when this value breaches the 70 threshold, it triggers a phenomenon known as a “failure swing top.” Within an overbought market, this failure swing top acts as an indicator of diminishing bullish momentum that was previously prevailing. Subsequently, the line graph commences a downward descent, illustrating the change in market sentiment.
On the other hand, an RSI reading that is below 30 shows that the market is oversold. A figure below 30 triggers a failure swing bottom whereby the bearish momentum slows down, and the trend is reversed.
Being an indicator, the RSI tops out or bottoms out before the actual market reaches its top or bottom. As such, the RSI indicates that a significant reaction or a reversal in the momentum is right around the corner. For this reason, traders can use it to create trading strategies.
RSI Trading Strategies
There are many trading strategies that rely on the RSI indicator. Traders use the RSI to find and take advantage of opportunities when the market is overbought or oversold. They can also make the most of it by combining it with other indicators, adjusting the calculation period, or using the divergence strategy.
In forex trading, divergence refers to the instance when the price movement of a currency is opposite to the direction of a technical indicator. All in all, regardless of the approach taken, the RSI indicator has proven beneficial and results in the following RSI trading strategies:
- Oversold and overbought trading strategy
- Trend following strategy
- Divergence trading strategy
Oversold and Overbought Trading Strategy
Traders use this strategy to determine whether they should enter a trade or not. The RSI indicates whether a market is oversold or overbought, so the index provides a basis for buying or selling a currency. For instance, when the RSI is below 30, thereby signifying an oversold market, the price of a currency correspondingly drops. However, this also indicates that the price will very likely rise from the low levels. As such, traders buy when the market is oversold.
Once you have entered the trade, always keep an eye on the RSI. Sell your assets when the RSI indicates that the market is overbought because prices are only likely to drop.
Trend Riding Strategy
Also known as trend following, this strategy entails taking advantage of sustained uptrends, beyond the oversold marker, in order to capitalize on further price improvements.
To enter a buy trade using this strategy, you have first to create an RSI line that captures the price trend from the oversold point onward (this line has a positive slope). You will then ride this trend and only buy when the currency pair’s price goes beyond the trend line. You will then hold position and exit when the RSI indicates that the market is overbought, after which you will exit the buy trade. Doing this will ensure that you gain the greatest number of pips, thus maximizing your profit.
To enter a sell trade, use the RSI to establish the overbought point and subsequently create a line from this point forward. This line should have a negative slope. You should then enter a sell if the price of the asset goes below the trend line. It would be best to take profit (exit) when the RSI indicates that the market is oversold.
Divergence Trading Strategy
In his book, Welles. discussed the divergence strategy. It entails identifying sections within both the candlestick bar graph and the RSI graph where the trend diverges, i.e., when the slope of one trend line, say, for the candlestick graph, is positive but is negative for the RSI graph. The inverse also holds.
In his explanation, Welles stated that divergence occurs when the RSI is increasing, but the price movement is flat or decreasing. Alternatively, it results when the RSI is decreasing, but the price movement is flat or increasing. Although divergence does not occur after every turning point, it is ubiquitous when the change in momentum is significant.
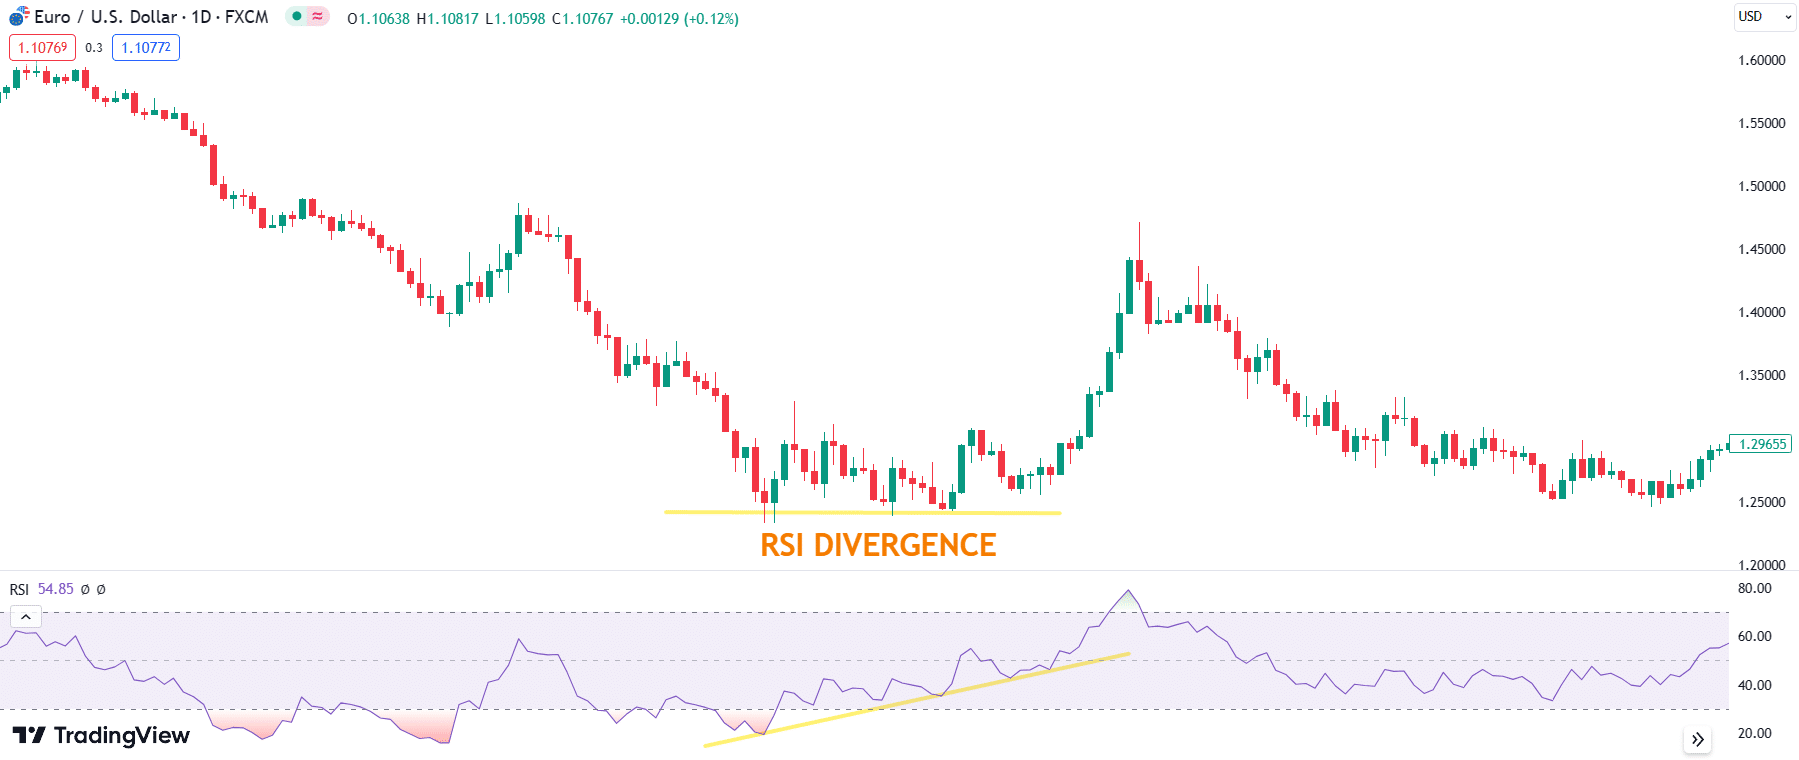
In forex trading, any divergence that follows a good directional move indicates that a turning point is on the horizon. For instance, it shows that the price will start dropping or increasing relative to the previous price trend. As such, the divergence trading strategy entails using divergence to establish when to exit a position.
Benefits and Disadvantages of RSI Indicator
The benefits and limitations of the RSI indicator include the following:
Benefits
- It provides oversold and overbought signals
- It enables traders to maximize profits by signalling that they should exit positions before significant price changes occur
- It aids in price prediction
Disadvantages
- Traders cannot use the RSI indicator alone as it cannot provide a comprehensive view of the market, instead, they have to use it alongside the bar chart and other trend indicators
- The market can sustain a prolonged overbought or oversold status, rendering the RSI useless in such instances
- It may fail to result in a clear trend despite the calculations yielding RSI values.
Conclusion
Introduced in 1978, the relative strength index (RSI) has established itself as a pivotal oscillator index. Its predictive abilities for future price shifts provide traders with valuable time to exit positions. This is achieved by identifying instances of market oversold or overbought conditions. An RSI value below 30 signifies an oversold market, while a reading above 70 indicates an overbought market. When these principles are applied to forex trading, they give rise to strategies like trend riding, divergence, and overbought-oversold trading. Implementing these strategies effectively can lead to increased profits. However, it's crucial to emphasize that relying solely on the RSI index is ineffective and unreliable; traders should incorporate it in conjunction with other indicators for a more comprehensive approach.
If you'd like to learn from expert traders using indicators like the RSI, you can join our free telegram group and get a taste of how the pros do it.


 falls into these two categories – it is an oscillator that also happens to be a momentum indicator.)