Top 5 Forex Trend Indicators
In the realm of currency trading, technical analysis takes center stage, bolstered by the utilization of forex trend indicators. This strategic approach offers a vital advantage by guiding traders on where to allocate their attention. The reliance on gut feelings, often leading to detrimental outcomes, is thus replaced. At its essence, technical analysis empowers traders to pinpoint optimal market entry and exit points, resulting in improved strategies and timing. This, in turn, augments the potential for profitability within forex trading.
Technical analysis involves studying historical price patterns to unveil insights that enable the prediction of future price movements. This comprehensive method integrates various types of technical indicators: trend, oscillator/momentum, volatility, and resistance.
Among these categories, trend indicators hold remarkable significance in forex trading due to their user-friendly nature and their propensity to yield more substantial gains when accurate, in contrast to losses when incorrect (more on this later), make them a focal point. So in this article, we're exclusively delves into the top 5 forex trend indicators, illuminating their relevance for trading currency pairs.
What are Forex Trend Indicators?
Forex trend indicators tell traders the direction of price movement, i.e., whether the prices are increasing (trend going up) or reducing (trend going down). Typically, increases lead to an uptrend defined by a trendline with a positive slope. At the same time, decreases cause a downtrend that you can decipher if you observe a trendline with a negative slope.
Notably, while pricing is the main variable associated with forex trend indicators, other variables also exist, resulting in multiple types of forex trend indicators. The existence of so many indicators means that there is no one way of trading. As such, it would be best for you as a trader to learn what each of these forex trend indicators entails to maximize your profits and reduce your exposure to risks. You can also combine trend indicators with a solid knowledge of chart patterns to give your trades an extra boost.
Additionally, it is also important to understand what the other types of indicators, i.e., momentum, volatility, and resistance, entail. This is because some indicators cut across multiple categories.
For instance, the parabolic stop and reverse (SAR) indicator includes characteristics of both a forex trend indicator and a momentum indicator. It helps traders establish when to buy or sell.
Top 5 Forex Trend Indicators
In this article, we will detail the top 5 forex trend indicators. These include:
- Directional movement indicator (DMI)
- Moving average indicator
- Average directional index (ADX)
- Moving average convergence divergence (MACD)
- Parabolic SAR
Directional movement indicator (DMI)
Developed by J. Welles Wilder in 1978, the directional movement indicator (DMI) identifies the direction to which a currency pair is moving. Its operating principle is simple. A currency pair, whose price moving upwards, will have a series of higher highs and higher lows. Similarly, in the event it is moving downwards, the price chart will feature a series of lower highs and lower lows. From these, two prices will definitely stand out – the lowest low and the highest high.
At the same time, for currency pairs, which are traded continuously from Sunday 5 pm EST to Friday 5 pm EST, the current highest high and lowest low prices can be compared to the highest high and lowest low prices recorded the previous day. This comparison is the reserve of the DMI.
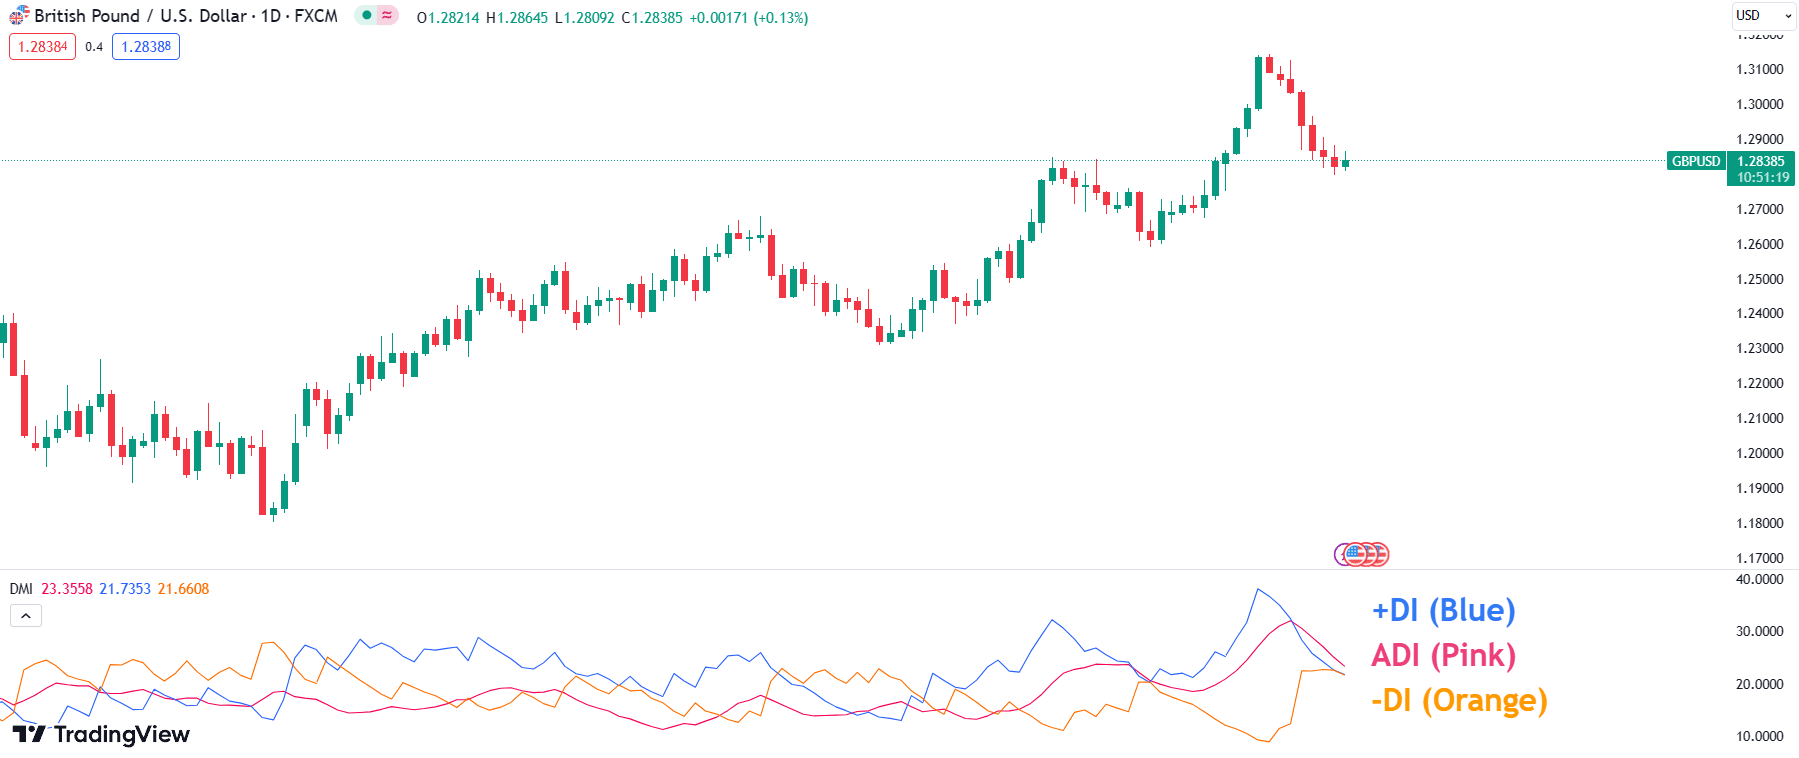
DMI entails mathematically drawing two trendlines, +DMI (or +DI) and -DMI (or -DI), representing each of these two categories (the highest high and lowest low). The +DMI shows the difference between the current highest high and the highest high recorded the previous day. Similarly, the -DMI represents the difference between the current lowest low and the lowest low recorded the day before. Notably, your preferred trading tool will have in-built algorithms to calculate both the -DMI and +DMI, so there’s no need to know the formulae.
Typically, when the -DMI, represented as an orange line in the ADX, +DMI, and -DMI Indicator Lines image below, is above the +DMI, represented as a deep blue line, this means the price is decreasing. Inversely, when the green line is above the red line, then the price is increasing. If the lines are crossing each other back and forth, the price of the currency pair is fairly stable (moving sideways), meaning no trend exists.
Moving average indicator
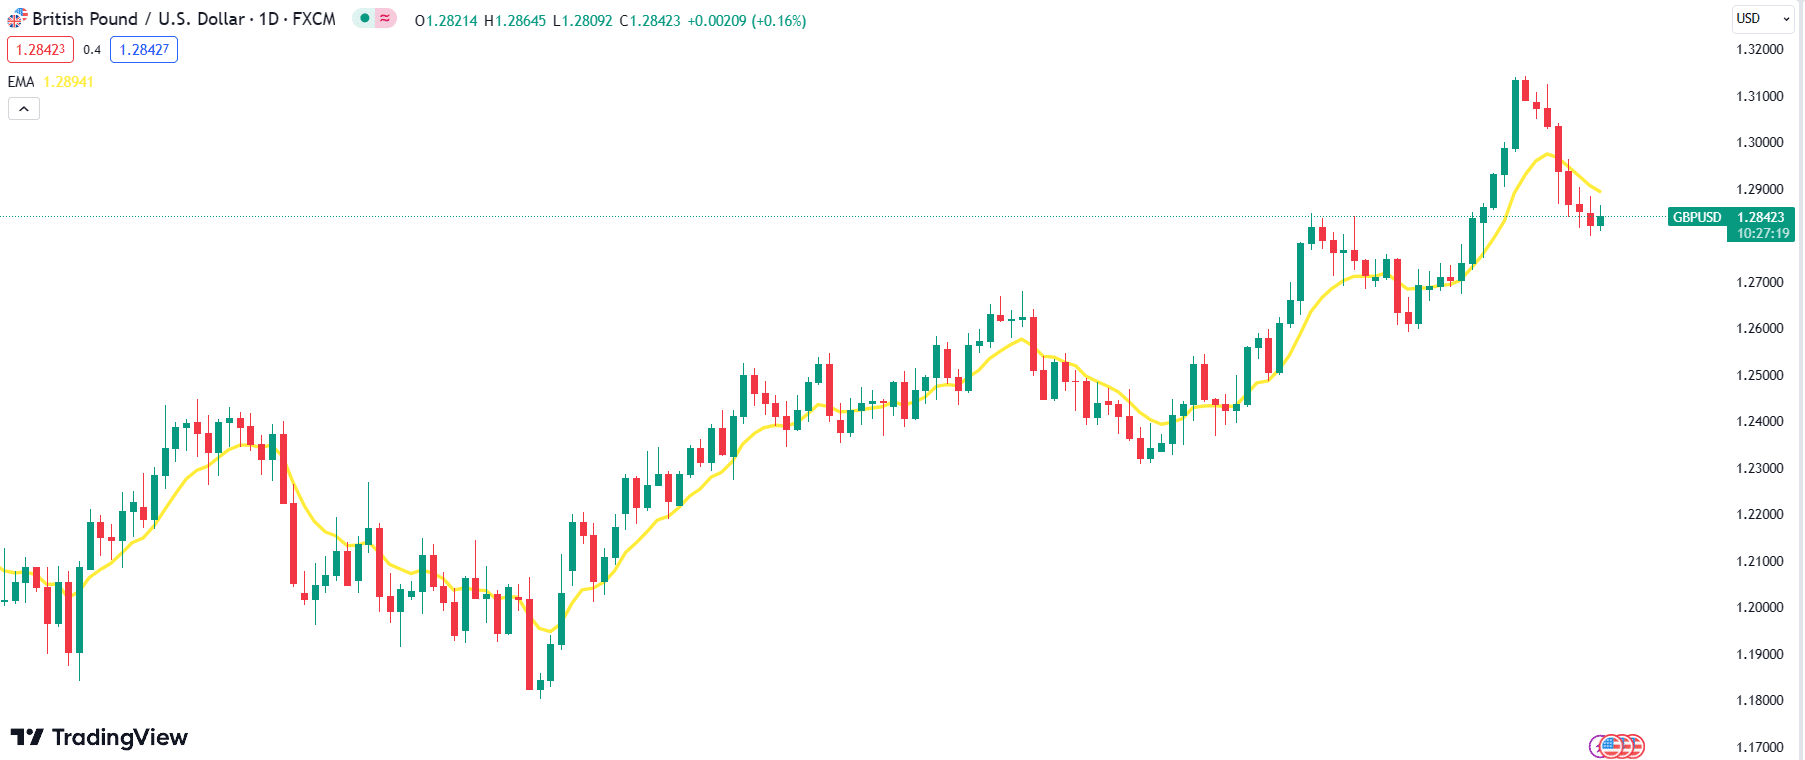
The moving average indicator helps traders determine the trend, i.e., whether the currency pair is on an uptrend or downtrend. As a trend-following tool, it helps determine whether you should enter a long or short position.
The moving average indicator is based on two types of moving averages:
- The simple moving average (SMA)
- The exponential moving average (EMA)
The SMA is arrived at by calculating the average price of the currency pair over a given number of days. Typically, 5, 10, 20, 50, 100, and 200 days are used. On the other hand, the EMA is an average over a given period, but it is weighted to emphasize the recent prices and, therefore, reflects the impact of the recent price changes. In this regard, the EMA is the primary MA used in moving average indicators.

To determine the trend using the moving average indicator, plot three different EMA graphs representing the 5-, 20-, and 50- day periods. Thereafter, observe the uptrend or downtrend by looking at the following elements:
- If the 5-day EMA is above the 20- and 50-day EMAs, there is an uptrend. Buy immediately when the 5-day EMA crosses the 20-day EMA from below to above.
- If the 5-day and 20-day EMAs are below the 50-day EMA, there is a downtrend. Sell the currency immediately the 5-day EMA crosses the 20-day EMA such that it now appears below the curve.
Importantly, the moving average indicator is a lagging indicator. As such, it only provides historical data on the prices but does not predict future price movements.
Moving average convergence divergence (MACD)
While the moving average indicator helps identify the trend, i.e., what direction the prices will follow, it requires confirmatory intervention to increase reliability and accuracy. This is where the moving average convergence divergence (MACD) comes in.
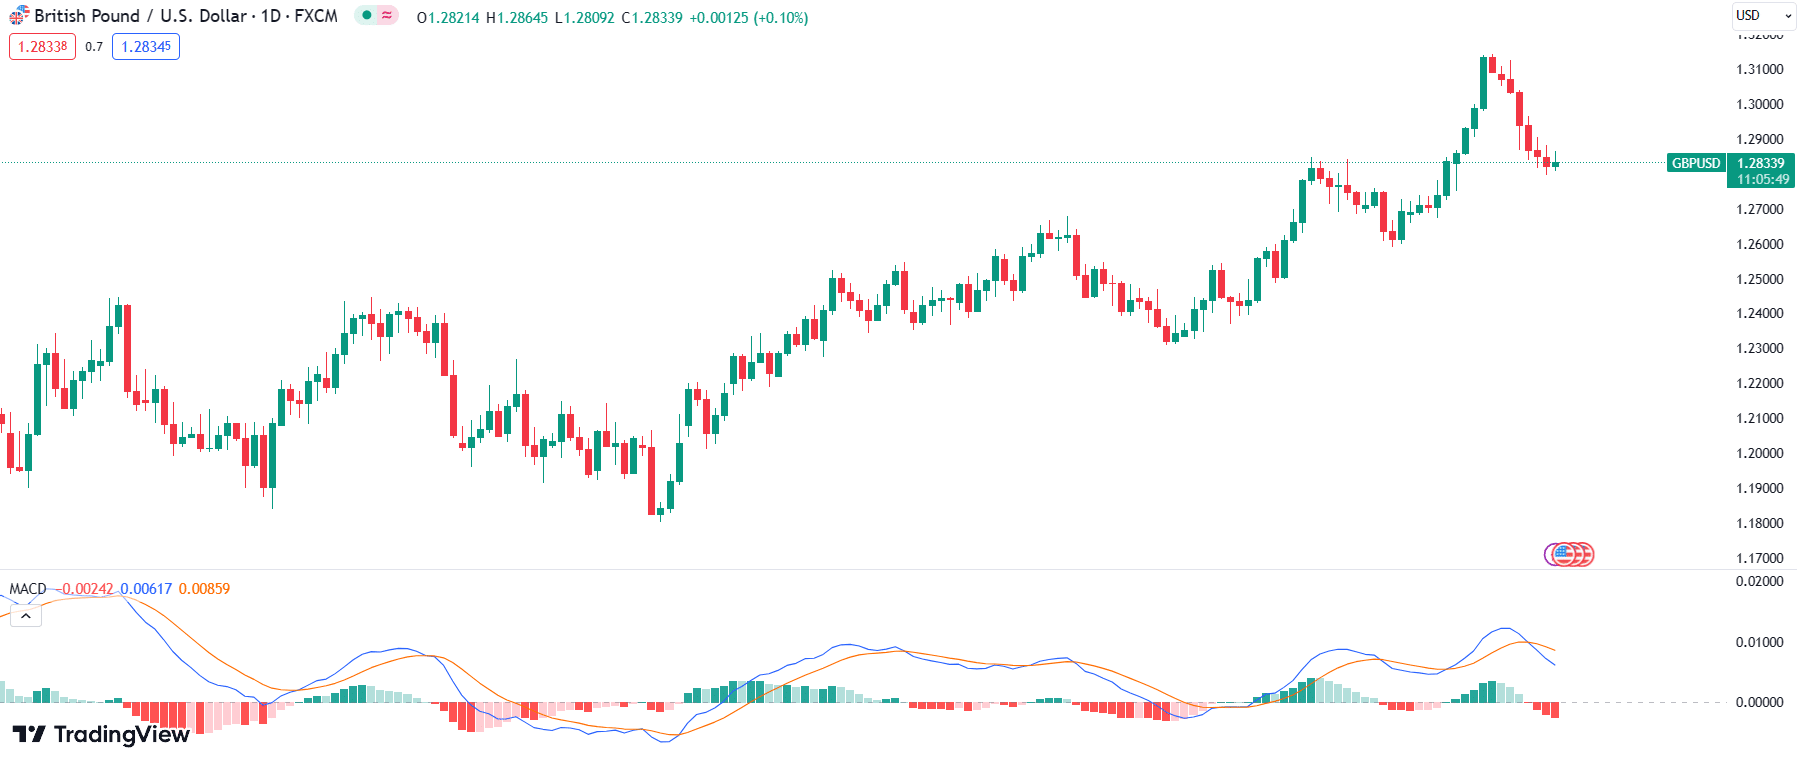
The MACD is a trend-confirmation indicator, which confirms the downtrend or downtrend. It is a line whose value is calculated by subtracting the 26-day EMA from the 12-day EMA. A 9-day EMA is then calculated, which, when plotted, results in a signal line.
If the MACD line crosses above the signal line, the trader should buy the currency. Inversely, if the MACD line goes below the signal line, the trader should sell.
In addition, the graph containing the signal line and MACD also features a histogram, which represents the unit distance between the two lines. In instances where the MACD line is below the signal line, the histogram is negative, meaning there is a downtrend. If the MACD line is above the signal line, the histogram is positive, confirming the existence of an uptrend.

Average directional index (ADX)
The directional movement indicator features three lines, two of which we have discussed above – the +DMI and -DMI. The third is known as the average directional index (ADX), another top 5 forex trend indicator. The ADX measures the strength of the trend. It does not detail whether the price is going up or down. Instead, it helps a trader establish whether the currency pair is experiencing sideways movement (price is stable) or if there is indeed a trend (price continually increases or decreases at closing).
Usually, the ADX is a range with values between zero and 100, each of which tells of the trend strength, as below:
| Value | Strength |
| 0-25 | Weak trend |
| 25-50 | Strong trend |
| 50-75 | Very strong trend |
| 75-100 | Extremely strong trend |
During the course of several days, or even a year, the values are bound to change, resulting in a line graph. A rise in the ADX line indicates that the strength is increasing and the price is rising too. Similarly, if the ADX line is falling, the strength of the trend is weakening.

Parabolic SAR
Also developed by J. Welles Wilder, the Parabolic Stop and Reverse, or Parabolic SAR for short, helps traders determine the end of a trend and, therefore, designate appropriate points to exit or enter a trade. Like the MACD, it also supplements trend-following tools.
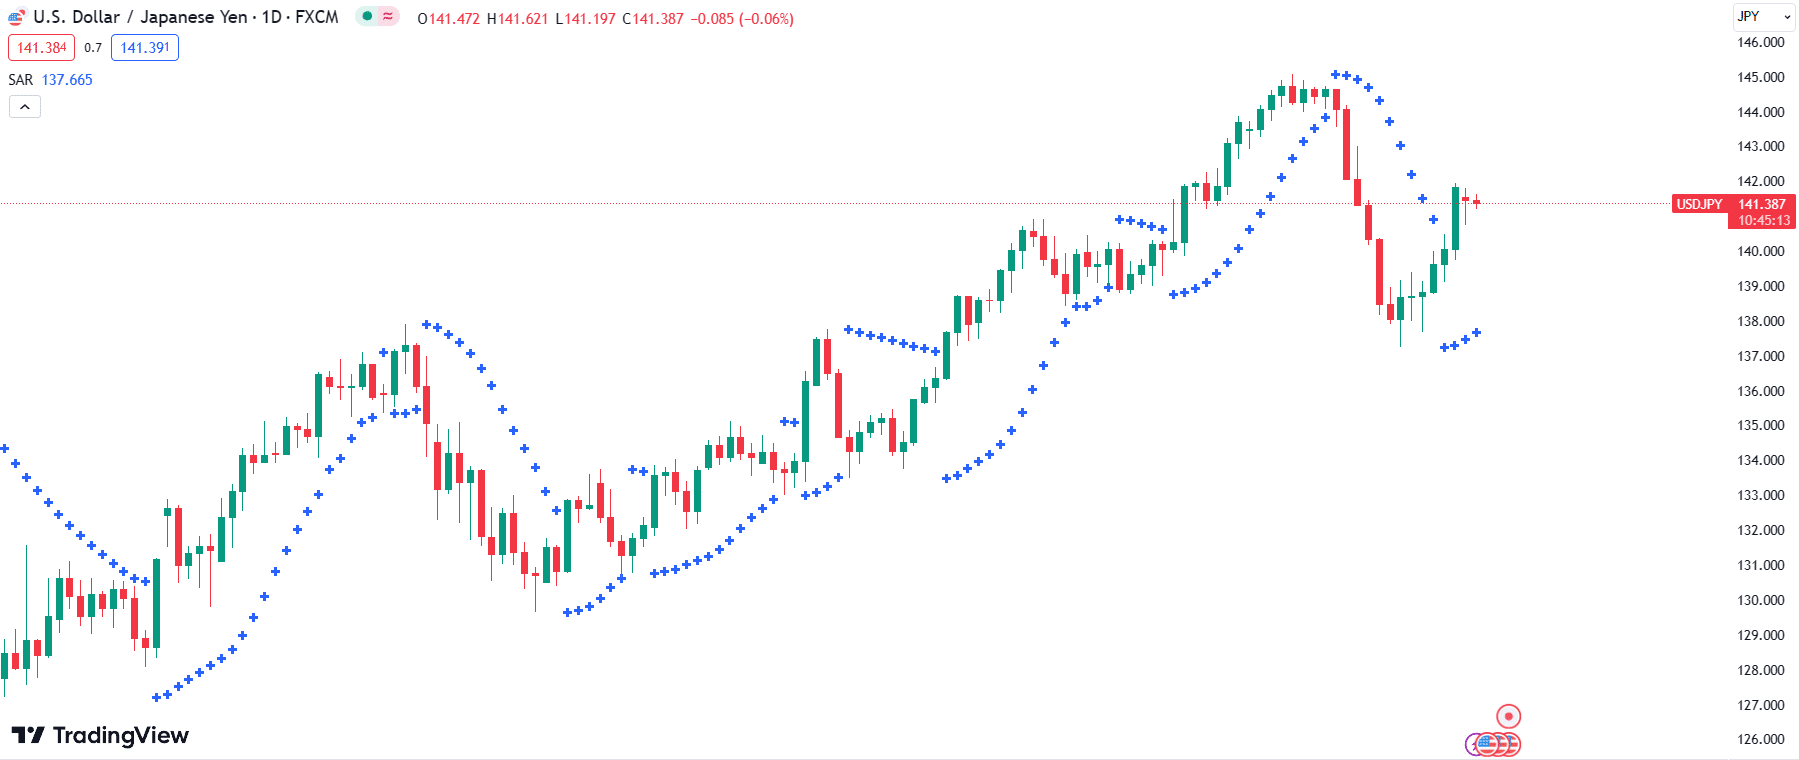
The Parabolic SAR is represented graphically through a series of dots, which form a parabola, hence the name. However, the placement of each small dot is not by mere chance or formality. Each dot is drawn either below the price – when there is an increase – or above – when the price is dropping. This placement ensures that the indicator can generate signals when the dots’ location reverses such that the dots now form on the opposite side of the price chart.
Nonetheless, Parabolic SAR is not an effective forex trend indicator when used in isolation. For instance, it is only effective in a steadily trending market. When deployed in a sideways market, it tends to generate inaccurate signals because the dots constantly move to the opposite sides or the prices. In this regard, its creator, J. Welles Wilder, suggested that traders use it in concert with the ADX to get a clearer picture of the trend and its strength.

Importance of Forex Trend Indicators
These top 5 forex trend indicators help traders identify the direction of movement of a particular currency pair and subsequently attempt to profit by simply trading in that identified direction. This logic is part of what makes forex trend indicators very popular among traders.
This popularity also stems from the fact that the top 5 forex trend indicators offer several benefits, including:
- Indicate when to buy or sell
- Help traders identify the type of market – whether it is trending or sideways
- Ease of use as it enables traders to easily profit by trading in the direction of price movement
- Observe bias (discussed below)
- Increases ability to make money (discussed below)
Observe bias
Forex trend indicators enable traders to observe bias by prompting them to interrogate the causes of a particular trend. In forex trading, multiple factors can lead to price movements, including breaking news, which cumulatively constitute a bias. These top 5 forex trend indicators, as well as other trend indicators, point out the existence of a bias, although they do not outrightly mention exactly what it is. Traders can then speculate that this bias could shift the odds of success and profits in their favor, regardless of the amount of money they could make.
Increases ability to make money
We highly recommend that whenever trading, you should always use a stop-loss order to minimize losses. This order, when combined with forex trend indicators, increases traders’ ability to make money. Imagining that the trader, using forex trend indicators, has identified and is leveraging a bias, the trader stands to gain more for as long as the bias exists than what they might lose if wrong. After all, when wrong, the stop-loss order kicks in.
Tip: As a trader, you should use multiple forex trend indicators instead of just relying on one. Combining indicators with signals from professional traders can be rocket fuel for your portfolio!
Conclusion
Among the various types of indicators in use today, forex trend indicators stand out as the most widely adopted. Their popularity stems from their user-friendly nature, making them accessible to traders at all levels. Beyond ease of use, these indicators offer a range of advantages, including profit optimization and strategy identification. By incorporating a selection of the top 5 forex trend indicators highlighted in this discussion into your trading endeavors, you can unlock these benefits and tailor trading strategies that align with your objectives.


