5 Types of FOREX Indicators
FOREX Indicators: The Basics
Get your candlesticks in order folks because we're about to dive into the world of technical analysis. In particular, we'll show you the five most important types that will give you an edge in your trading.
FOREX indicators are tools that technical analysts use to forecast price movements by analyzing historic trends in the currency market. This is the extent of most people’s knowledge of the subject. Using this as our square 1, I will take you a couple of steps forward and embolden you to use these financial indicators in your next trade.
There are several technical indicators you can use. More indicators ultimately cause more perplexity around which ones you should use for your trades. So, that is the issue we will address first.
If you are starting out, experiment with just one indicator. In fact, if you're completely new, you can look at signals from professional traders and rely on their technical knowledge instead!
When you are using a single indicator, start by defining a time frame. Would you like to apply the indicator to hourly, daily, or weekly data? Let’s assume you want to work with daily data. Then, you could use moving averages for the previous 50, 100, 200 days. While you could work with just one moving average, it is always good to look at a couple of them together.
If you have basic knowledge of technical analysis, you may choose to work with a combination of indicators.
This is a level-up in terms of complexity because now, in addition to the time frame, you must also choose indicators that will work well with each other. As a rule of thumb, refrain from choosing two indicators from the same category because they are likely to tell the same story. Speaking of which…
Classification of FOREX Indicators
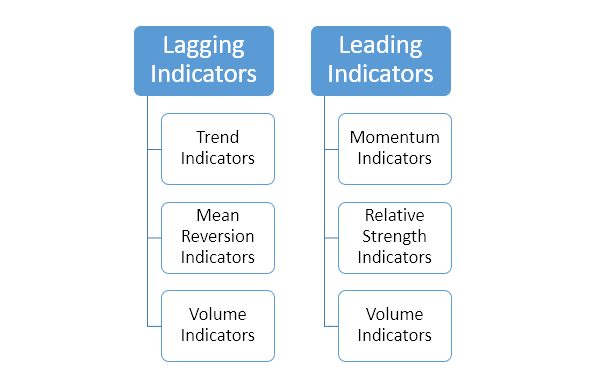
There are several ways of classifying FOREX indicators.
If you are wondering why volume indicators appear in both categories, it is because it functions as both a leading and a lagging indicator.
Let’s break these down further into some commonly used indicators that feature in each of these groups of indicators.
Note that this is not an exhaustive list. These are the most commonly used indicators in each category. There are hundreds, if not thousands, of indicators today like Fibonacci Retracement and Chaikin Oscillator, but today our focus will be just the big ones.
The Most Widely Used FOREX Indicators
Moving Averages
Moving averages are the most common technical indicator. Even if you are not a trader, you may have heard of moving averages at some point.
Moving averages are just what they sound like, the progressive average for each point in your time frame. Essentially, it smoothens the movement of price over the time frame you are analyzing.
Moving averages have a simple purpose. They tell us the direction of the trend and help us ascertain the resistance and support levels for a given financial instrument.
Traders use moving averages for different time frames while analyzing movements in a currency pair. The most commonly referred to time frames are 15, 20, 30, 50, 100, and 200 days. Intuitively enough, the moving averages in a shorter time frame will be more sensitive to a change in the price of a currency pair.
Generally, short-term traders prefer moving averages over a shorter time frame while long-term investors rely on moving average over a longer time frame. However, these are preferences and not rules set in stone. Experiment with these metrics to see which complements your strategy the best.
So, how would you interpret moving averages?
When a moving average is heading upwards, it tells us that the price of a currency pair is in an upward trend, and vice versa.
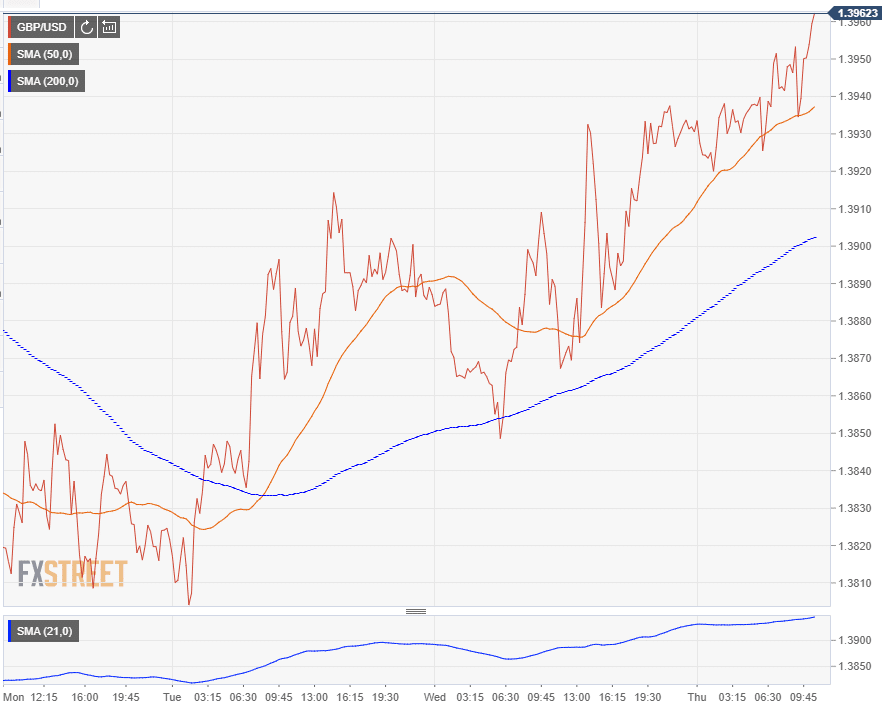
Another indication of upward momentum in the price of a currency pair is a crossover. Let’s say you add a 50-day MA line and a 200-day MA line to your chart. When the 50-day MA line crosses above the 200-day MA line, we call it a bullish crossover, i.e. it is telling us that the price is headed upward. If the 50-day MA line crosses below the 200-day MA line, we have a bearish crossover.
For example, here is a chart for the GBP/USD pair for the week starting March 8, 2021:
Notice how the 50-day MA line (red) crosses over the 200-day MA line (blue) around 8:00 on Tuesday. This is a bullish crossover suggesting the price is entering an uptrend.
Moving averages also form the basis for Moving Average Convergence Divergence (MACD), which will discuss towards at #5.
Relative Strength Index (RSI)
Another very commonly used indicator is the Relative Strength Index. Unlike moving averages, the name does not immediately convey what this metric tells us—so let’s take a deeper dive.
The RSI was the birthchild of J. Welles Wilder Jr. who coined the indicator in his book “New Concepts in Technical Trading System.” While the formula to compute RSI is pretty straightforward, you may want to refer to the in-depth explanation in the book if it spikes your curiosity.
The RSI formula:
If we assess the components of this formula, it becomes clearer how the RSI metric will behave depending on the price movement. So the 14 day RSI gives you that, over the past 14 periods, whether closing prices are positive more often than negative.
The RSI is a momentum oscillator that oscillates between 0 and 100. Traditional wisdom dictates that an RSI less than 30 means the currency pair has entered the oversold territory, while an RSI of 70 and above suggests that the currency pair has entered the overbought territory.
However, things are never this black and white. RSI is a complementary indicator, which means it is a part of a larger equation when you are formulating your strategy. For example, it is common for the RSI to consistently stay above 70 or below 30 for extended periods when a currency pair is gaining momentum in either direction.
RSI works best when markets are choppy and lack any strong trends. If the RSI is stuck in the oversold or overbought territory for an extended duration, it is more likely to generate false signals. If you see strong trends emerging in the market, move over to moving averages.
Expert traders use the RSI amongst other indicators when compiling their trading signals. You can use these alongside your own analysis to find the right times to trade.
Bollinger Bands
This Mean Reversion indicator helps traders gauge volatility in the FOREX market. John Bollinger laid the foundation for Bollinger Bands in the 80s by using moving averages as a basis.
Central to the Bollinger Bands is the exponential moving average line. The upper and lower bands are just the exponential moving average plus/minus 2 standard deviations (aka 95% confidence interval). Think of the upper and lower bands as a dynamic resistance and support level for the currency pair you are analyzing.
Generally, the price is viewed to be moving as expected as long as it fluctuates between the bands. However, if the price of the currency pair consistently touches the upper or lower band, it signals that the pair is overbought or oversold, respectively.
Naturally, these signals too, are subjective. A price breaking out above the upper band may be viewed by some traders as a continuation of upward momentum, while others may interpret it as a sign of a possible reversal.
Stochastic Oscillator
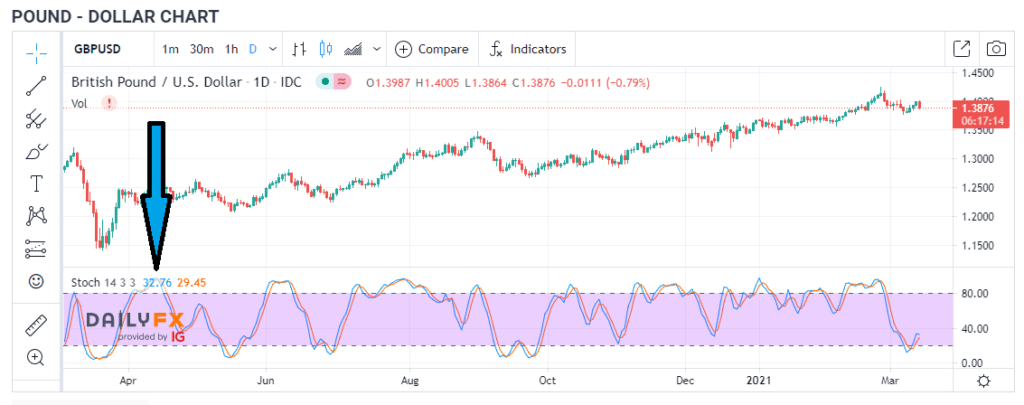
Stochastic oscillator is another indicator that closely resembles the RSI. It ranges between 0 and 100 and tells traders if a currency pair is overbought or oversold.
The basis of stochastic oscillator is the assumption that in an upward trending market, the closing price of a currency pair will be closer to the day’s high, and vice versa.
Traditional wisdom advises that a value of less than 20 tells us that the currency pair is oversold, while a value of over 80 tells us that the currency pair is overbought. Again, just like the RSI, there is more to it and applying this rule standalone is a recipe for disaster.
Let’s work with some numbers to see how the stochastic oscillator works. All we need to do is plug in some numbers into this formula:

- Last closing price – $1.39
- Lowest low of 14 periods – $1.38
- Highest high of 14 periods – $1.41
The marginal difference in the value is a result of us having rounded the prices to 2 decimals instead of 4 to make computation easier.
The stochastic oscillator value is less than 50 because the closing price ($1.39) is in the lower half of the range ($1.38 to $1.41). If our reading would have been below 20 or above 80, it would suggest that the price has neared its low or high (respectively) for the time period in question.
Moving Average Convergence Divergence
MACD is a momentum indicator and has three components: the MACD line, signal line, and histogram.
- The MACD line is just a subtraction of the 26-day exponential MA line from the 12-day exponential MA line.
- The signal line is a 9-day exponential MA of the MACD line we talked about in the previous point.
- The MACD histogram is the difference between the previously mentioned signal line and the MACD line.
What should you look for with MACD?
When the MACD line crosses from under the baseline (0) to above, it is a bullish signal, and vice versa. Similarly, when the MACD line crosses from under the signal line to above, it is a bullish signal, and vice versa. If the crossover signals are confirmed by a divergence between the currency pair’s price action and MACD, it is viewed as a stronger signal.
If you are viewing MACD with a histogram, you will see that the histogram will plot above the MACD baseline when the MACD is above the signal line. This should not be surprising given that we already discussed that the MACD histogram is the difference between the signal line and MACD line. The histogram helps traders gauge the market for high bullish or bearish momentum.
While the MACD and RSI both ultimately measure the market’s momentum, they do so in different ways. RSI relies on the most recent price movements and their relation to the recent lows and highs, while MACD is just a measure for the relationship between the two exponential moving averages.
MACD is currently one of the most widely used technical indicators used today. However, novice traders must keep an eye out while applying MACD to their analysis given the possibility of frequent false positives.
Final Thoughts
I know this can feel heavy, especially if you are new to this. But, I got there, and so can you. Just start with one indicator (preferably moving averages) and master that indicator. As you gain experience, add one indicator from each category to your analysis.
If you happen to identify a profitable trade using one of these indicators, look for confirming clues with other indicators, and over different timeframes. Before making a move, always backtest your strategy by applying it to a currency pair’s historical data. Take a look at some signals from professional traders to confirm your interpretation. Only once you get the go-ahead, use your strategy in the live market.


