Introduction to Fractals in Forex
As we all know, forex is the world’s largest financial market that has attracted traders and investors from around the globe.
Traders and investors use tons of patterns, indicators, and strategies to conquer the market, but we are unsure which are worth using. Nevertheless, out of so many price and candlestick patterns, we have fractals that are continuous price patterns used to identify reversals on the chart.
Now, if you have started reading this article already, that means you are interested in knowing what we have for you, how these fractals actually work, and how it will benefit you. If yes, then read this article and understand all the questions you have regarding fractals and how to use them.
What are fractals?
Price representations through candlesticks would remain quite random until you try to find the meaning through your analysis.
If you have been trading forex regularly, you would have noticed that the price creates certain patterns over time. To the novice chart analyst, the prices may appear random; however, the market makes repeating patterns that can be beneficial if you have a good piece of trading knowledge and experience.
A fractal refers to a reversal pattern on a price chart that consists of five or more candlesticks. In simpler words, you can understand it as a repeated occurrence of price patterns on every time frame.
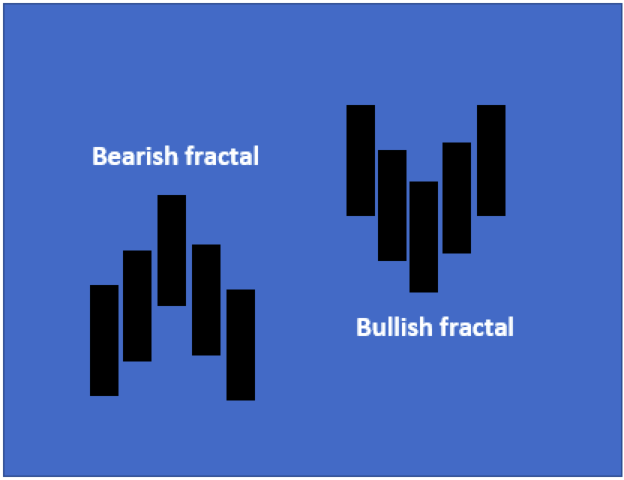
A reversal pattern can be the start of a bearish or bullish trend. Therefore, fractals can indicate bearish or bullish turning points.
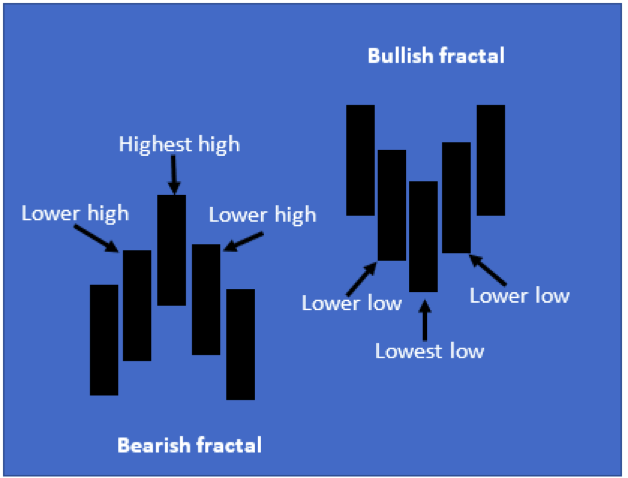
- A bearish fractal occurs when the middle candlestick is the highest high, and the two candlesticks next to it are the lower highs. This pattern also signifies that the price could move down.
- A bullish fractal occurs when the middle candlestick is the lowest low, and the candlesticks on each side are the highest. A bullish fractal pattern signifies that the price could move up.
These examples are perfect patterns, but traders should note that the market patterns can be slightly different; however, the basic rules will validate the trend.
There are also a few trend indicators that you can use to validate your trade.
The objective of using fractals is to benefit when the market is trending because during consolidation, there is no trend, and using fractals would not be profitable.
The fractal strategy was initially developed for the stock market because it had less volatility and high predictability.
Institutional traders use fractal strategies proving that the indicator is reliable and can have high success rates if applied correctly.
How to use fractals in forex trading
Now when you know what fractals are in forex trading, you might be happier to know that you actually don’t need to hunt for this pattern on the chart. Instead, there is a fraction indicator that you can easily apply to your price chart and use it.
One important point to note while using fractal indicator is that it lags, and you cannot draw fractal until we are two days into the reversal.
Nevertheless, the most significant reversals will continue for more bars, benefiting the trader. Once the pattern occurs, the price is expected to rise following a bullish fractal or fall following a bearish fractal.
1. How to add fractals indicator on the chart
We will illustrate how to add the fractals indicator step-by-step on a price chart.
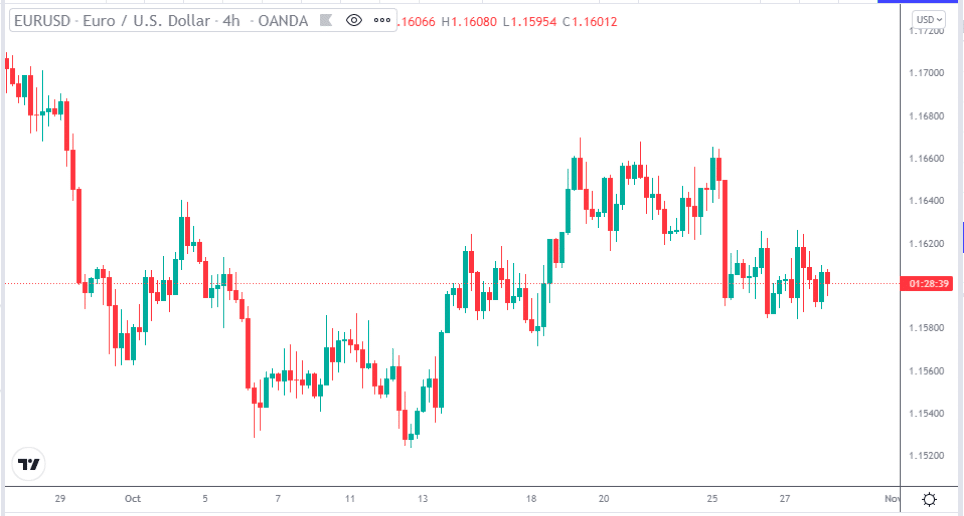
EURUSD 4-Hr time frame price chart (TradingView)
- The first step is to open the price chart for the pair you wish to trade.
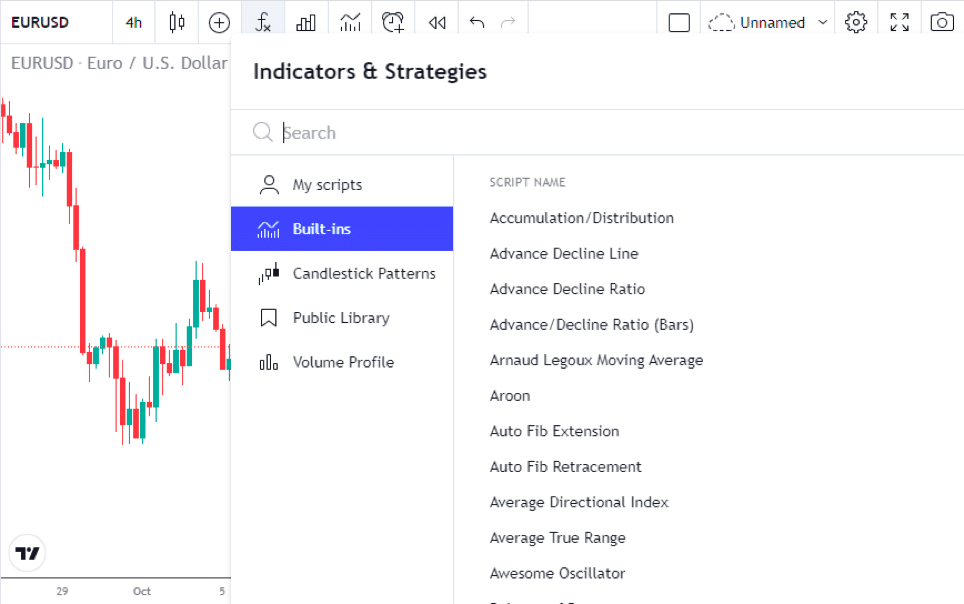
- On TradingView, you can click on the fx option, which will display a list of indicators and strategies.
- Once you click on ‘Built-ins,’ you will find a list of indicators that are preloaded on the platform.
- In the ‘search’ window, you can type fractals, and a list of options will appear. You can choose the built-in indicator, which is the ‘Williams fractals’ or any of the other indicators that traders have loaded as strategies.
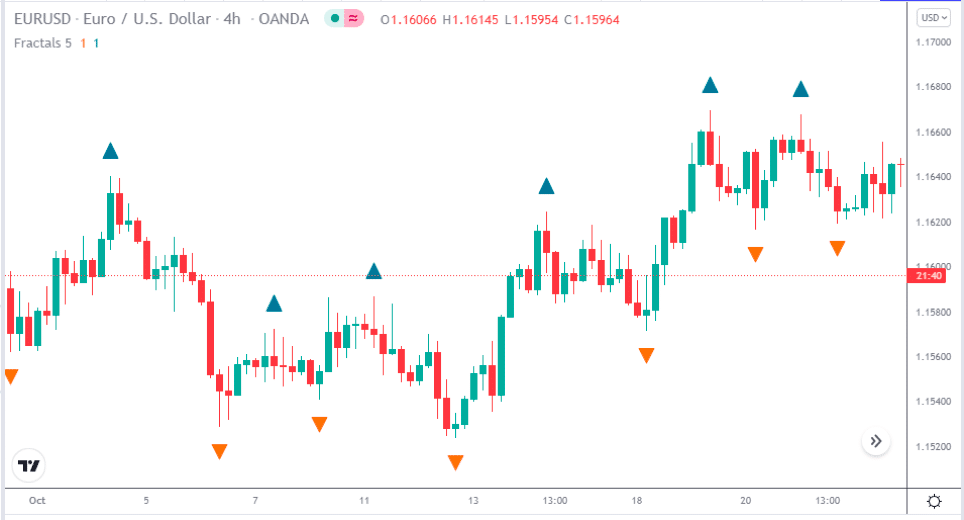
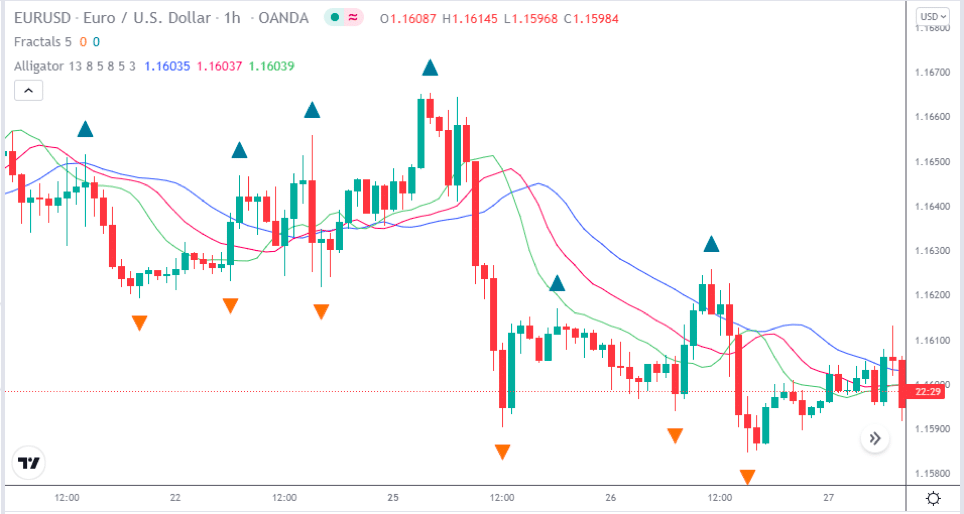
- Once you choose the indicator, it will be displayed as triangular shapes where the turning point in the market occurred.
- A triangle above a candlestick, pointing upwards, is a sign of a bearish fractal or turning point.
- A triangle located underneath a candlestick, pointing downwards, shows a bullish turning point.
Fractal trading strategies
Using fractals seems straightforward; however, there are specific rules to follow to ensure that you become consistent. Trading fractals with other indicators is a popular strategy that many traders use. We will discuss bullish and bearish strategies that you can learn using fractals.
-
Bullish strategy – Using fractals with Bill Williams alligator indicator.
In this strategy, we will look for buying opportunities using both indicators.
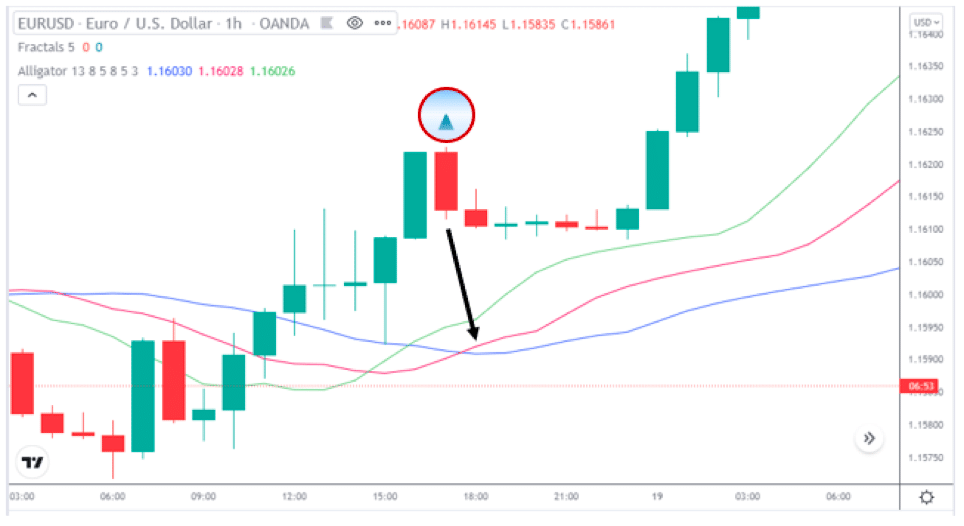
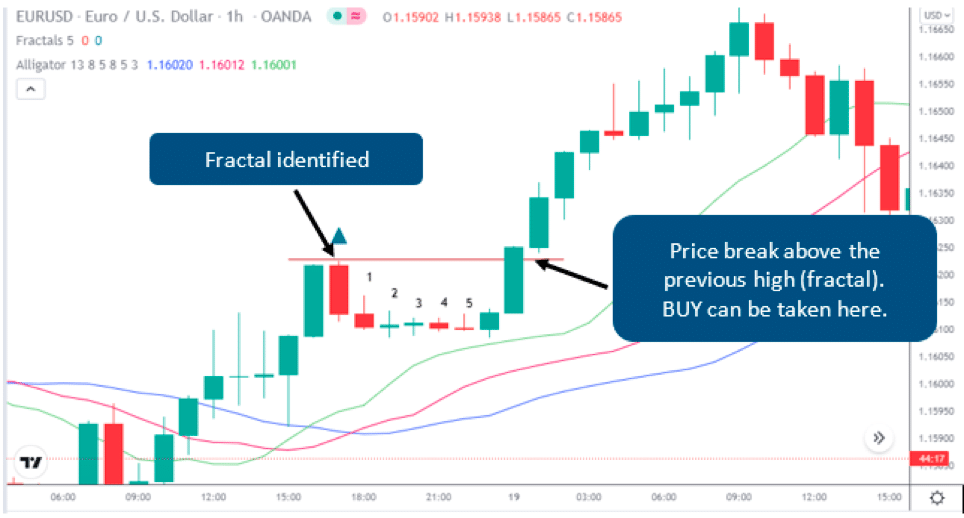
When the fractal appears, as in the above chart, it means at least five candlesticks are forming the reversal pattern.
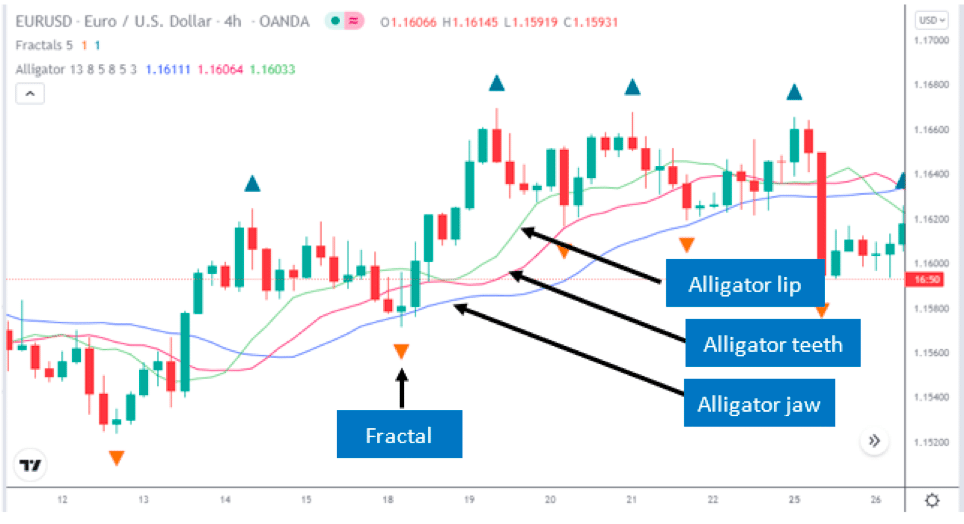
We have to add two indicators to our price chart, the Williams fractals and the Bill Williams alligator indicator. You can find both indicators in the TradingView indicator panel.
EURUSD price chart 1HR time frame
EURUSD price chart 4HR time frame
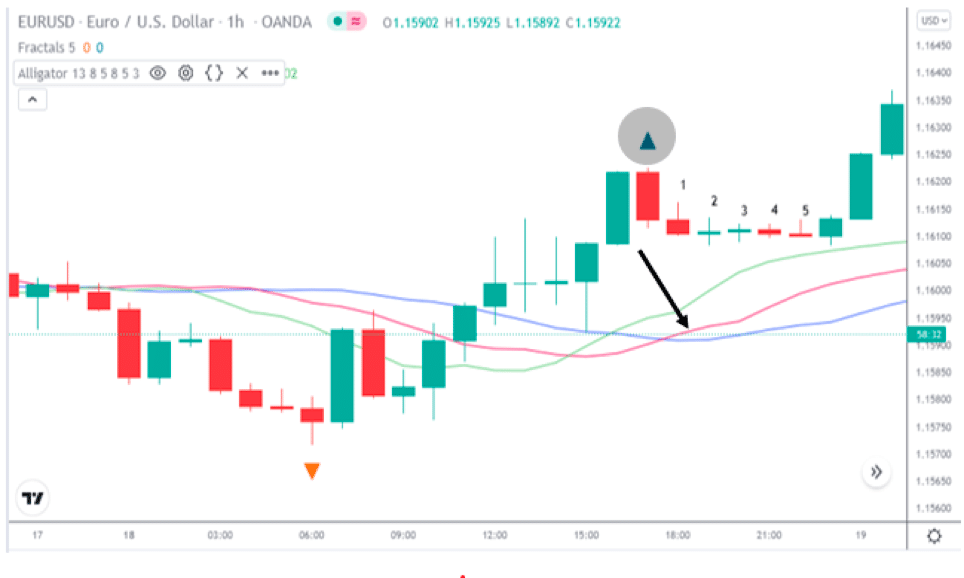
Step 1: For this strategy, the price should stay above the alligator lines.
Step 2: For a buy trade, the fractal must appear on top of a candle that formed above the redline (alligator teeth).
Step 3: The price has to be above the red line for five consecutive candlesticks. Furthermore, you would want to see a consolidation after the fractal formed, which means the price remains flat.
Step 4: The price has to break above the fractal that we highlighted to make a buy entry. The five candles should also not break lower to the downside and should stay above the alligator teeth (red line) and below the fractal.
Step 5: As we can see, the five consecutive candlesticks do not move downwards. The price then breaks above the fractal high, and this confirms a buy entry at the start of the next candlestick.
Stop-loss and Take profit targets
You can set the stop loss below the support level – about 15 to 20 pips below entry.
You can wait for the alligator lip (green line) to cross over the alligator teeth (red line) to exit the trade. Alternatively, when the second fractal appears, which indicates a bearish trend, you can exit the trade. This strategy can easily give you a 1:2 risk-reward.
-
Bearish strategy – Using fractals with Bill Williams alligator indicator.
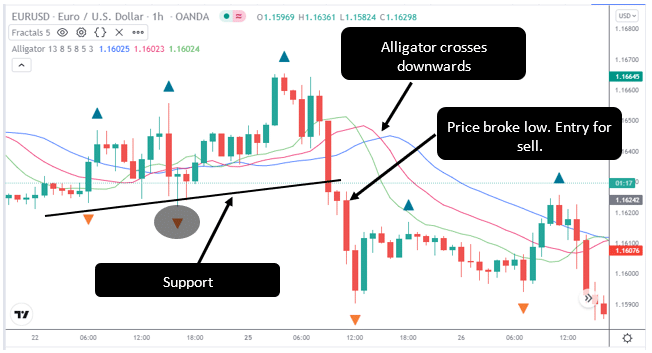
For the bearish strategy, we will combine the fractals indicator with the Alligator to find selling opportunities. Therefore, we will add both indicators to the chart the same way as for the bullish strategy.
EURUSD price chart
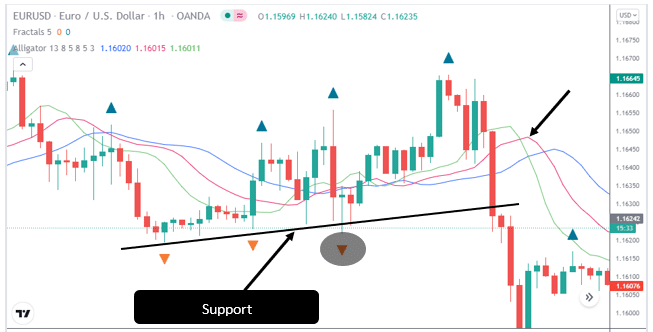
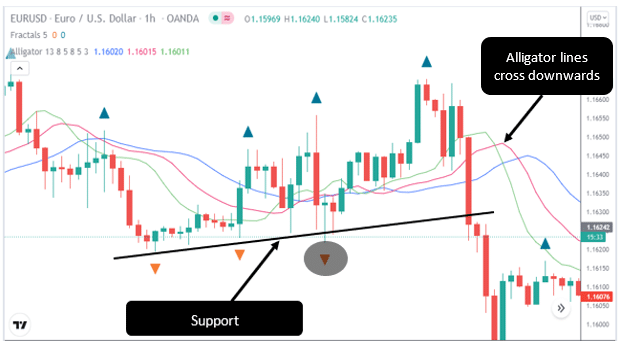
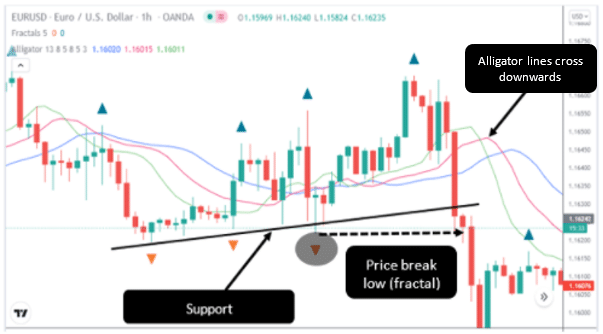
Step 1: We need to make sure that the price is above the alligator lines, as seen in the above chart.
Step 2: The next point is to identify the fractal which represents our support in this case.
Step 3: In step 1, the price was above the Alligator lines; however, for this strategy to work, the Alligator lines have to cross each other downwards, and the price will move down as well.
Step 4: Our next confirmation is to wait for the market to break the previous low, which is where we marked our fractal.
Step 5: All our points were validated, and we entered the market for a sell downwards.
Stop-loss and Take profit targets
For the selling strategy, you can place your stop loss 15 – 20 pips above your entry point. For taking profit, you can set your target for a 1:2 risk-reward ratio or when you see a bullish fractal appearing.
Pros and cons
As we can see, trading fractals are a profitable strategy; however, as with any trading indicator, we need to consider the pros and cons.
Pros |
Cons |
| ● Easy to identify
Fractals are easy to identify, and most charting tools have the indicators already built into the platform.
|
● Fractals lag
Fractals are lagging indicators; therefore, you have to wait for the formation of the pattern.
|
| ● Ideal for day trading
Fractals can be used on 1hr or 4hr charts, which is ideal for day traders who want to exit the market quickly. |
● Not accurate on lower time frames
Fractals accuracy on lower time frames are not good because the price movements are too rapid.
|
| ● Use for buy and sell trades
Fractals can be used to place buy or sell trades since the indicator can identify both trends.
|
● Not suitable as a single indicator
Fractals are best when combined with other technical indicators and cannot be used as a signal for buying or selling on their own.
|
| ● High accuracy with other indicators
Combining fractals with other indicators and price action makes for a successful trade. |
● Late entry
Due to the lagging nature of fractals, the entry points are late when the trend has already started. |
Key points to consider when using fractals
Before diving into the article, here are a few interesting facts to note about fractals.
- Fractals are lagging indicators.
- It is best to combine fractals with other indicators and not to use them in isolation since they can generate many false signals.
- Higher time frames generate more accurate and less fractal signals. Lower time frames generate more signals but are less accurate.
- For scalpers, it is advisable to trade fractals in multiple time frames but follow the long-term trend.
- Fractals can be found on most charting platforms, and there is no need to calculate them manually.
Final thoughts
Investing or trading in any financial market is risky, and it is always advisable to learn the basics before getting involved. Volatility in forex makes it more unique as it becomes easy for traders to make money even from the small fluctuation in the market.
It's often worth looking at signals from professional investors and combining this with your own knowledge of fractals in order to be more consistent in your trading.
As we already discussed, Fractals are lagging indicators since the pattern has to form for a confirmation of a bearish or bullish fractal. It is better to have an area of confluence in forex, meaning at least 3-4 scenarios signaling a BUY or a SELL. These, in terms, making your trading setup more powerful.


