
Trading Crypto with Ichimoku Cloud Indicator
The Ichimoku Cloud, which also goes by the moniker Ichimoku Kinko Hyo (translation: equilibrium chart at a glance), seems like a complex phenomenon at first. However, once you start getting comfortable with it, it will make your crypto trading decisions blazing fast.
It was developed by a Japanese journalist Goichi Hosoda in the 30s. The Ichimoku Cloud builds on the concept of a moving average (MA). For the uninitiated, a MA is a trading indicator that can help smooth out random fluctuations in an asset’s price by giving us a moving average of the price over a specific time period. You can combine it with signals from professional traders on telegram to make your trades more consistent.
What is Ichimoku Cloud?
The Ichimoku Cloud is a combination of several technical indicators used to discern the market’s behavior. The Ichimoku Cloud has five components:
- Two lines (called Leading Span A and Leading Span B), between which is a shaded area that we call the cloud.
- Two moving average lines (the Base Line and Conversion Line), one long moving average (Base Line, default period = 26), and the other short moving average (Conversion Line, default period = 9).
- One Lagging Span line that’s pushed 26 periods from the market price towards the chart’s left.
The Ichimoku cloud is an indicator that originated in Japan, it was used to trade in traditional markets. Nevertheless, human psychology remains unchanged across asset classes, including crypto. This means you can perfectly apply the indicator’s principles to the crypto-verse as well.
That said, as with any other trading indicator, the Ichimoku cloud generates the best results when used in confluence with other trading indicators. Before we dig deeper, let’s talk about how the Ichimoku Cloud works.
How Does Ichimoku Cloud Work?
When Goichi Hosoda used it back in the 30s, he used the numbers 9, 26, and 52 as settings for the Ichimoku Cloud indicator. Back then, Japan had a 6-day working week. The 9, therefore, represented 1.5 weeks, 26 represented a month, and 52 represented two months. However, since crypto markets operate round the clock, you can always tweak these settings to 10, 30, and 60.
Once you’ve done that, your trading tool will calculate the following to chart the Ichimoku Cloud:
Lagging Span Line
The Lagging Span (or the Chikou Span) line is just the current period’s closing price. As the name gives it away, the line jumps 26 periods into the past from the current price.
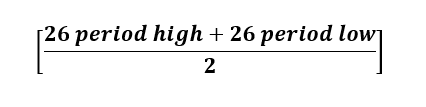
Base Line
The Base Line (or the Kijun-sen Line) lies at the center of the previous 26 candlesticks. The equation for calculating a given point on the line is:
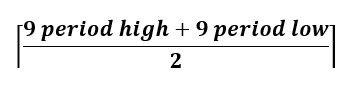
Conversion Line
The Conversion Line (or the Tenkan-sen Line) lies at the center of the previous 9 candlesticks. The equation for calculating any point on the line is:
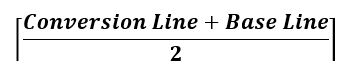
Leading Span A
The Leading Span A (or the Senkou Span A), also forms a part of the boundary of the cloud. The line is just a moving average of the Base and Conversion Lines as plotted 26 periods forward. Leading Span A moves faster than Leading Span B, is displayed as a green line, and the equation used to calculate a point on the line is:
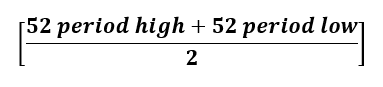
Leading Span B
The Leading Span B (or the Senkou Span B) forms another part of the cloud’s boundary. It’s the slower of the two lines forming the cloud’s boundary and it’s plotted 26 periods into the future. It’s the center point of the moving averages of the previous 52 periods. The line is usually displayed in red and is calculated as:
Kumo Cloud
The Leading Span A and B create an enclosed space that forms the Kumo cloud. It’s the most prominent element of the Ichimoku system. It’s displayed either in green or red; if the Leading Span A is higher than Leading Span B, the cloud is green-colored, and red otherwise.
What Does Ichimoku Cloud Tell You?
Even with five different elements in the mix, the interpretation isn’t all that difficult. When looking at an Ichimoku cloud, identify the lines Leading Span A and B first. Look at which line is above and below.
If the Leading Span B is above Leading Span A, it signifies that a crypto asset is in a downward trend and the cloud should be red. On the contrary, the Leading Span A is above Leading Span B, the crypto asset is starting to gain momentum and the cloud, in this case, should be green.
You can use the cloud to look for the following trading signals:
1. Trend
You can look for a trend signal that emerges based on the cloud’s position viz a viz the market price and the cloud’s color. If the prices have sustained above the cloud, the crypto asset is in a bullish trend. If the prices have remained below the cloud consistently, the crypto asset is in a downward trend. Barring a few situations, a price that keeps fluctuating within the cloud is viewed as neutral.
You can also use the Lagging Span line to verify a crypto asset’s trend reversal. The line offers better insight into the price action’s strength. It could, possibly, also be used to confirm a downward trend (when it moves under the price line) or an upward trend (when it moves above the price line). However, it’s best not to rely on the Lagging Span alone. Use it alongside other Ichimoku cloud elements for better results. You can also look at some other crypto trend indicators to confirm the trend.
The Ichimoku cloud’s strength is subject to its alignment with the broader trend though. When you interpret a signal keeping in view a more defined market trend, the signal’s reliability can be considered far higher than a signal that makes a brief appearance in the opposite direction to the current trend.
In summary, an upward trend in a bearish market is considered a weak signal. Before you place a trade by interpreting the Ichimoku cloud, look at the bigger picture and consider the cloud’s color and position.
2. Momentum
Three elements come together to create a momentum signal: Base Line, Conversion Line, and Price. When the Price and/or the Conversion Line intersects the Base Line from the bottom, it signals bullish momentum. If either (or both) of those lines intersect the Base Line from the top, it signals a bearish momentum.
3. Support and resistance
The Ichimoku chart is also a great tool for spotting zones of resistance and support. You can also establish support and resistance zones when you have an Ichimoku cloud. To establish your zones, look for Leading Span A and Leading Span B in the chart.
The resistance line, during a downtrend, is the Leading Span A, while it’s the support line during an uptrend. Similarly, the Leading Span B is the support line during a downtrend, and the resistance line during an uptrend. The candlesticks on your chart will inch nearer to the Leading Span A in both instances.
Advantages and Disadvantages of the Ichimoku Cloud
Like any other technical indicator out there, the Ichimoku cloud has some strengths and weaknesses. To become an ace trader, you need to know both so you can dodge bullets that come your way and leverage the full potential of the Ichimoku cloud when an opportunity presents itself.
Advantages of the Ichimoku Cloud
Following are some advantages that Ichimoku Cloud offers traders.
1. You can analyze performance extensively with a quick look
There aren’t a lot of technical indicators that give you the luxury of understanding trend, momentum, and support or resistance zones in a jiffy. The Ichimoku cloud uses multiple calculations and offers you, as a trader, a much more convenient way to evaluate the chart and the correlation of all lines plotted on the chart. For a trader, time is a valuable asset. The quicker you can absorb the information on the chart, the quicker you can capitalize on opportunities that arise during the trading day.
2. An indicator that can single-handedly confirm a trend
Granted, we just discussed that it’s best to use the Ichimoku cloud in confluence with other indicators. However, the indicator can offer traders an insight into an asset’s trend and signal. Some traders swear by the Ichimoku cloud and don’t shy away from using the Ichimoku cloud as their only indicator. That said, it’s still recommended you confirm with other indicators before trading. The option to just use Ichimoku cloud, though, remains available.
3. Customizability
Since Ichimoku cloud packs in five elements, most trading platforms give you the option to remove elements that you’re not currently using out of the screen. This gives you a clearer view of your chart and allows you to focus on elements that matter the most for a particular trade.
Disadvantages of the Ichimoku Cloud
Even though the Ichimoku cloud is a great indicator, it’s not the Chuck Norris of indicators. It’s got some very real disadvantages that you need to stay cognizant of.
1. It’s not forward-looking
The Ichimoku cloud is based on moving averages. This makes them reliant on lagging data which means it may not appeal to you if you’re someone who prefers exclusively using leading indicators.
2. Too much data may not always be good
It’s great to be able to have all information on a single chart so you can get the information you need without moving too much around. However, some might find it harder to eyeball the information they need. The concentrated volume of data could make you lose focus. Sure, you may be able to remove some of that data from your trading platform, but that does require an additional step and can slow you down.
3. Reduced relevance for long-term trades
Moving averages are a potent piece of weaponry for intraday traders. However, moving averages that you see in an Ichimoku cloud may not provide much value for traders who want to take a long-term position. For instance, if you want to take a position where your strategy plays out over the next 3 quarters, the moving average on the Ichimoku cloud may provide little insight. You can, though, use long-term moving averages to supplement your analysis.
Final Thoughts
If you’re planning to take very short-term positions while trading crypto, the Ichimoku cloud is certainly a great tool to have in your pocket. This is one of the few indicators that are sophisticated, yet easy to understand and implement in your day-to-day crypto trading. However, if you’re entering a long-term position, you may want to look beyond the Ichimoku cloud and try out some signals on telegram from professional traders.
Though it’s possible to use the Ichimoku indicator as a standalone (in fact, some traders do), it’s best not to take on that kind of risk, especially since you have several other options that can confirm a signal for you. Relying just on the Ichimoku cloud does add some risk to your trades. Trading and the crypto-verse are already risky playing fields, so using the Ichimoku cloud in confluence is highly recommended.


