
Crypto Trend Indicators for 2021
Over the last few years, cryptocurrencies have been charting a new path in the world of alternative finance. The pace of innovation and adoption has been breathtaking and is reminiscent of the adoption of the internet in the late 90s. Strap yourself in and get ready to be blown away by these trends in the crypto market.
Currently, digital assets are unregulated and unrecognized by most governments. There is no one point of failure that can be taken down. The arrest of a single CEO does nothing to affect the network, as is the case with Bitcoin (BTC)
Given the current structure of the economy, centralized actors still hold majority power and influence. They balance between money, currency, finance, and consumer behaviors.
The digital asset market is considered too small to have an impact on the real economy. And indeed, the space does need time to mature and deliver more real-world solutions.
The first step toward maturity was made when the open market decided to accept BTC as an independent value and a protocol to store said value. This step has been furthered by BTC and other assets being used as a final cross-border settlement. This was seen in an export transaction between Argentina and Paraguay, where BTC was accepted for a shipment.
As we wait for the second leap from a store of value to a breakthrough product, now is a great time to learn about the future of finance.
Studies have emerged investigating the habits of crypto-investors and the overall global market. Things such as risk appetite, funding cycles, and time preference are patterns that can indicate when are the best times to buy, hold, or sell digital assets. These trends can be measured and represented in three ways; fundamental analysis, sentimental analysis, and technical analysis.
Fundamental analysis is a method of measuring an asset's intrinsic value based on factors to determine if the price is fair, below, or above par. These considerations include a range from the micro and macroeconomic to the company's approach to management. For cryptocurrency, this means the behavior of market participants, given that everyone participates voluntarily.
These behaviors can be quantified by actions such as hardware purchases for mining farms. These include but are not limited to ASIC units and GPU mining rigs. Supporting infrastructure developments such as energy farms dedicated to large-scale mining, power purchase agreements for large-scale miners, on/off-ramps, decentralized autonomous organization (DAO) behavior.
For our purposes, here are the fundamental factors we'll be looking into:
- An increase in mining difficulty/ Hash rate
- Stock to flow ratio for digital assets
- Funding from the community, VC/angel, and corporations.
- Community participation (miners, node count, etc.)
Technical analysis
- RSI and Volume
- Exchange volumes- inflows vs. outflows
Sentimental analysis
- Institutions getting into crypto
- Government regulations
- Overall market value
Mining Difficulty and Hash Rate
For this section, we are referring to blockchains using proof-of-work systems.
Mining difficulty is a measure of how easy it is to produce a new block and, by extension, mint new coins. Mining difficulty is represented by the hash rate of the network, as hashes are the unit of measurement for work done on the blockchain.
The current structure of BTC and ETH relies on miners. These miners solve complex mathematical questions to earn the right to update the network. The architects of these assets merged economic theories into code by giving participants an incentive to play by the rules.
For end-users, this creates a safe space to transact and to continue trusting the code, as they know that the blocks are honest by their proof-of-work structure.
This systemic trust can be represented by the consistent increase in mining difficulty and hash rate since 2009. As shown by the screenshots below, since 2016, both the mining difficulty and hash rate have steadily increased. Both metrics are hinged on more machines being deployed to secure the network. That is, more resources being brought into the network for added security.
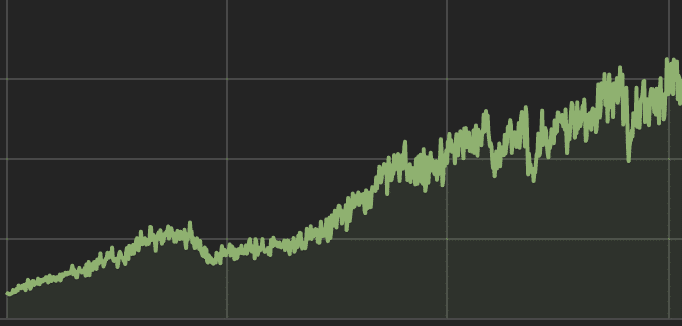
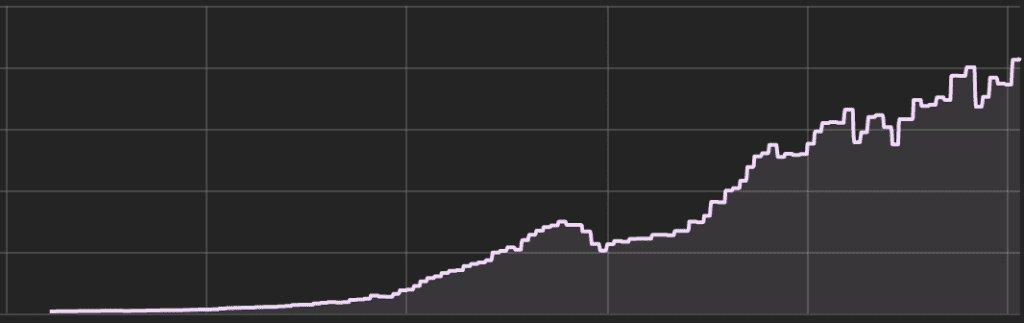
An increase in the hash rate will cause the software to increase the difficulty to make sure that blocks are produced at regular intervals. For bitcoin, this is every 10 minutes.
For BTC, the difficulty-retargeting algorithms adjust every two-weeks to keep miners using their best machines to maximize hashes per kWh of energy consumed.
Simply put, keep an eye on the hash rate to determine:
- The network's health
- Active participants
- The long-term viability.
Proof of stake mechanisms like ETH 2.0 have to be considered differently, compared to PoW systems. Early on in ETH's development, mining, and securing the protocol was important. Seeing the issues with BTC, Ethereum sought to use a new method of governance.
The simple fact is that commercial miners represent a form of centralization. Their presence creates an unfair balance of power. Since the advent of digital assets, the overarching theme has been to avoid central actors who dominate and manipulate the system. At the time, it was not practical to implement a system without miners. There needed to be maturity in the shape of products that showed the uses of programmable money. The ETH ethos is one of encouraging anyone to imagine a financial tool and represent it in code.
The question becomes, what are the metrics one can use for ETH 2.0 or similar blockchains?
- Number of validators- For ETH 2.0 this currently stands at 92,607
- The total amount of ETH being staked ~2.9M ETH at a current value of ~ USD 4.4 billion.
Keeping an eye on these figures can give an overall idea of network health and community participation. The phrase “money where your mouth is” resonates here. Each participant wants to see the system flourish and experience growth in personal wealth.
Stock to flow ratio
The stock to flow ratio is a measurement of new supply entering the market relative to the readily available stock. Typically, this ratio is reserved for commodities such as precious metals where the consumption is low, and the supply is limited by natural constraint. In essence, it is a value that represents scarcity, and the higher the ratio, the better the expected value over the long term. The figure represents the years it would take to double the current supply at the current production rates.
Physical gold, for example, has a stock to flow ratio of approximately 59. Meaning it would take 59 years to double the currently available gold.
Since BTC has a fixed monetary supply, anyone can validate this ratio for themselves.
For example, as of the writing of this article, the circulating supply is 18.6 million. Approximately 900 are being added daily. The current stock to flow ratio is therefore 18,624,275/328,500=56.69.
It would take 56 years and seven months to double the amount of BTC, if bitcoin kept being produced at the current rate. As the total supply is capped, when plotted on a graph against price, the current price action can be better understood, and future price action can be projected. Therefore, keep an eye on the stock to flow ratio to rationalize the price action over time.
Ethereum (ETH) is not fighting for the same recognition or use as BTC. Instead, as an asset, it has become a super-computer or, it can be better described as a virtual machine. In fact, the Ethereum Virtual Machine is the evolution from the immutable ledger to the smart ledger.
Imagine for a second that almost every product in the physical world uses some form of oil. In the same manner, ETH became that backbone for digital asset companies and products. Acting as a substrate, ETH has been used to build many crypto-juggernauts. Yes, some eventually move to their own protocol, but this is after being born on ETH.
The Flow of Funding
ICOs have become almost a curse word when speaking about the digital asset revolution. But without it, many very innovative projects would not have been crowdfunded. Thinking differently about money, you will understand that it represents three things all at once; the meeting of the financial, social, and political spheres. In this case, ICOs show how to get global access to funding.
Let's be clear, during the initial ICO craze, many millions were lost to fraud. Most new technologies are used by criminals first as it gives a perceived edge for them to operate. Technologies can be tracked due to the open ledger, and, eventually, they will be found. But I digress; the ICO behavior showed that with an idea, ready funding is available.
Since 2017, here are the annual amounts raised by ICOs:
2017 ~$7 billion
2018 ~ $24 billion
2019 ~$27 billion
2020 ~ $4 billion
This trend shows that the ability to crowdsource is still available. By looking into the companies that have done well in the ICO space, you can understand how to structure your company or service to get funding from the community.
Interestingly, whereas retail-driven open funding left the ICO space, more institutional, private, and VC capital has entered. They can be seen buying entire companies at the pre-seed phase. Since these are usually considered smart money tracking these companies and figures where available gives you the confidence to interpret information and position yourself correctly in the market.
Technical Analysis
When considering the crypto-markets, understand one thing- it NEVER sleeps. Let me repeat- IT NEVER SLEEPS. The market is global and unrestricted in its nature, creating a situation of perfect liquidity. Online trading makes settlement times instantaneous. The use of algorithms is also very prevalent in the digital asset space.
Therefore, news, accurate or not, does cause wild swings in an asset's price. Use the following metrics to better understand an asset's underlying value and use a combination to guide buying or selling decisions.
RSI and Volume
History never repeats, but it often rhymes. The use of any technical tool is to predict future price movements.
Using the RSI only gives information in a vacuum. Using RSI and volume provides contrast and allows one to track the trend of a selected digital asset. The ideal ranges for RSI in crypto are the levels 30 and 70. 30 indicates the best time(s) to buy, and 70 represents the best time(s) to sell. However, when considering volume, the ideal levels are 37.5 and 62.5. Since RSI is a lagging indicator, it will swing wildly. However, using the RSI will help to inform the best trading periods.
Finally, the time horizon is paramount; do not try to make minute by minute trades based on swings in the RSI. Instead, use this information with fundamental analysis to determine if the buy/ sell signal is valid over your chosen time frame. 14 units usually give a solid enough range for the average trader to use. You can combine indicators like the RSI with signals given by experienced traders on when to buy and where to set your stop-losses.
Inflows vs. outflows
Thanks to the open ledger, it's easier to track, record, and independently verify the exchange inflows and outflows. Even with whale and institutional moves, everyone can see the market changes occurring in near real-time. These inflows represent the movement of both digital assets and fiat currency. Therefore you should know the wallet addresses of exchanges and keep an eye on both their reported AND verified volumes.
These volumes show when investor sentiment is high and low. In times of high volume, the sentiment is high. Exuberance has entered the market. This is the best time to take gains off the table. When the reverse is true, and volumes are low, move into the market aggressively with long-term assets.
Sentimental analysis
General public awareness has changed. The narrative of blockchain = criminal has not stuck. It's especially here that the notion of voluntary participation adds consideration to the financial powers that be.
The fact is that you do not have much if any control of your currency, governments do. Additionally, once the decision is made, there is no option to reverse it. If the rule is broken, prison time or worse the is the stick.
It is the stick of fines and license revocation that affects sentiment in the market. During 2017 when the world's governments spoke tough rhetoric against digital assets, the sentiment prevented greater infrastructure investments. It took institutions such as MicroStrategy, The Rothschild Investment Corp, and JP Morgan to establish intrinsic value and boost sentiment. Therefore, the behavior of persons who know and use BTC and digital assets are different.
The interest of institutional investors has given governments the need to make digital assets legal in 33 countries, illegal in others, and an outright ban in 23 nations.
With institutions publicly getting into digital assets, this is causing what Andreas Antonopoulos stated years ago. Sovereignty is being reintroduced to the world and soon governments will have to come to people and ask rather than direct and dictate.
Looking at the longer time horizon, chances are that in your lifetime, your government will devalue your currency. It is wise to seek alternative investment options as a hedge against your government's decisions.


