
Best 8 Bitcoin Indicators for Cryptocurrency Trading in 2023
Over the past few years, it has become evident that predicting the price movement of Bitcoin is no easy task. Fortunately, there are tools available to assist in making more informed predictions – these tools are known as indicators. Bitcoin indicators, combined with technical analysis, can help traders forecast the price movements of cryptocurrencies with greater accuracy. By utilizing historical data to create mathematical models of expected price action, these indicators offer valuable insights. Traders can visualize the data from these formulas on a graph, overlaying it onto a trading chart to aid in decision-making.
While Bitcoin indicators cannot provide a foolproof prediction of price movements, they are based on the principle that price action exhibits momentum. The stronger the momentum in a particular direction, the more challenging it becomes to reverse it. Indicators leverage graphs and formulas to offer a clearer understanding of the potential actions of buyers and sellers.
Many of the indicators featured in our list were developed by seasoned traders. Regardless of your level of trading experience, you can benefit from these indicators and trading strategies. However, it is important to note that traders are continuously refining their skills, developing new strategies, and acquiring expertise. Therefore, we encourage you to consider subscribing to Bitcoin or other crypto trading signals directly from professional traders. This way, you can fully capitalize on the wealth of knowledge and experience that top traders bring to the table.
Without further delay, let's delve into our comprehensive ranking of the 8 Best Bitcoin indicators for crypto traders.
1. MYC Trading Indicator
The MYC Trading Indicator is a private indicator that uses a combination of trend analysis and momentum oscillators to accurately determine when a cryptocurrency will enter a bullish or a bearish phase.
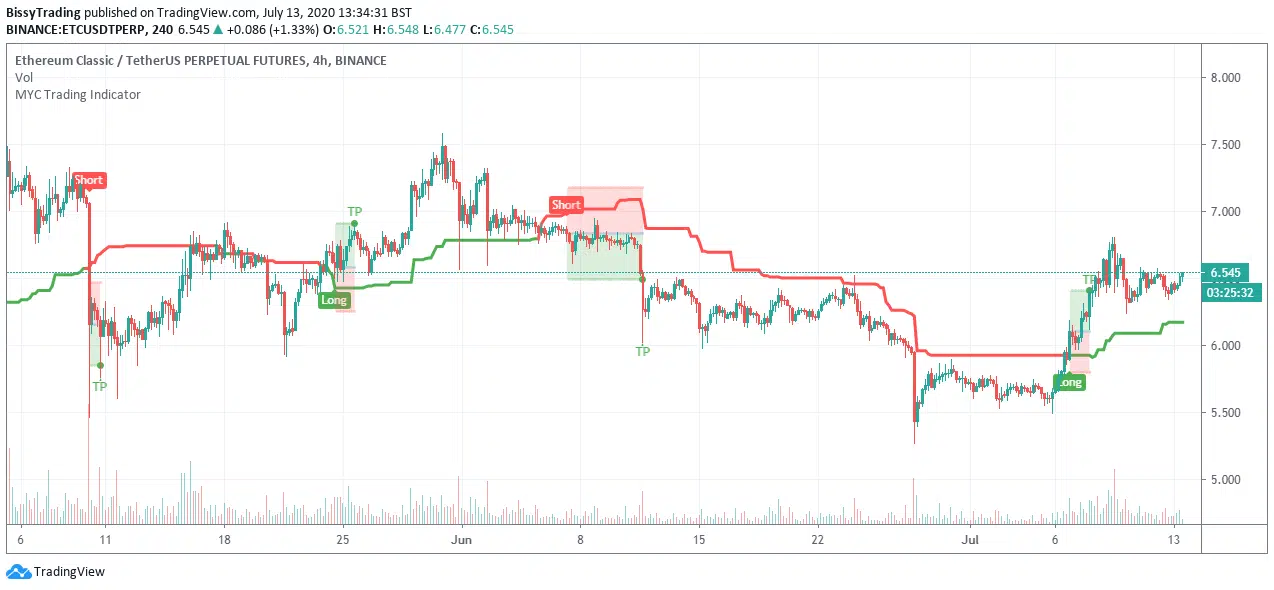
A key feature of the indicator is the trendline, which when the price crosses upwards, indicates that a long signal may be printed, and conversely, when the price crosses downwards indicates that a short signal may be printed. Unlike with other public indicators such as the RSI and Bollinger Bands, this indicator provides a recommended entry as well as exit point so that traders can focus more on determining the size of their position or the leverage.
The indicator can be used with the following trading pairs, and along with it, below are the percentage returns and accuracy for the indicator:
- BTC – Return: 200%, Accuracy: 70%
- ETH – Return: 200%, Accuracy: 70%
- LTC – Return: 250%, Accuracy: 70%
- BCH – Return: 100%, Accuracy: 75%
- ETC – Return: 350%, Accuracy: 70%
- EOS – Return: 250%, Accuracy: 70%
- TRX – Return: 650%, Accuracy: 90%
- LIN – Return:350%, Accuracy: 90%
Getting Started:
To get started with the MYC Trading Indicator, simply follow the below instructions.
1) If you have the Telegram messaging app, you can get started by reaching out to the admin by sending a message to: @MYCSupportBot who will grant you access so you can test the indicator for yourself. If you don’t have the Telegram messaging app then you can also get started by sending an email to: [email protected].
2) You can also join the free crypto signal group: MYC Signals, so you can see the performance of the indicator for yourself by receiving live trades.
2. Relative Strength Index (RSI)
Introduced four decades ago by Welles Wilder, a renowned technical analyst, the Relative Strength Index (RSI) has become a staple for traders seeking to identify potential market corrections in Bitcoin's price. This indicator enables traders to gauge when Bitcoin's price deviates significantly from its perceived “true” value, providing an opportunity to capitalize on the market's subsequent self-correction. Over time, the RSI has proven to be an invaluable tool for navigating the volatile crypto markets, offering traders optimal entry points.
Operating on a complex formula, the RSI determines whether an asset, such as Bitcoin, is in an overbought or oversold state. The resulting value falls within a range of 0 to 100 and can be visually represented on a chart as an oscillator, displaying wave-like patterns. By utilizing the RSI, traders gain valuable insights into market conditions and can make informed decisions to optimize their trading strategies in the dynamic world of cryptocurrencies.
RSI = 100 – 100 / (1 + RS)
RS = Average of X periods closes up / Average of X periods closes down
X = It's recommended to use 14, but you can use any number you like
An asset is considered oversold or undervalued when the RSI drops below 30. On the other hand, it's deemed to be overbought if the RSI goes above 70.
Bitcoin Indicators: How To Use Relative Strength Index (RSI)
It's easy to identify when an asset will cool off even for a short period, and this is visible if the chart is in the overbought territory. Once the RSI passes 70, you can be sure there will be a pullback.
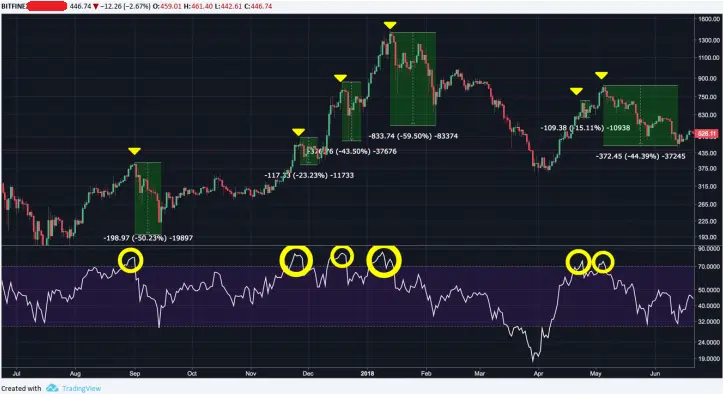
According to the chart above, the asset was in the overbought territory on six occasions. As a trader, overbought conditions offer a chance to take profits on a position or even close it entirely. A trader could also open a short position and profit from the downward price action.
The RSI also shows when an asset has reached a point of exhaustion after continuous bleeding by returning an “oversold” value. This is anywhere below 30, and it means it's highly likely that the bulls will take control and drive the price upward.
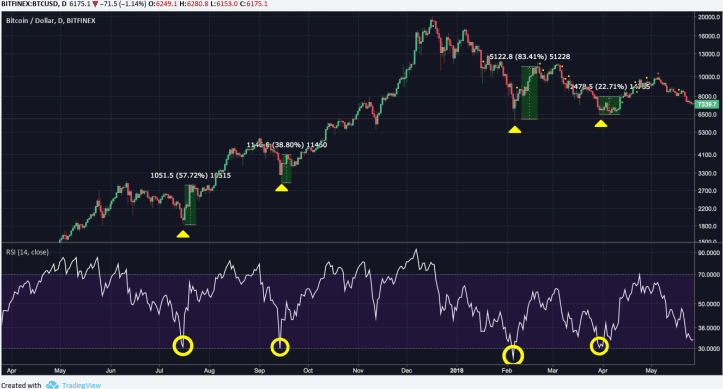
The chart above shows that when the asset dropped below 30 RSI on four occasions over 11 months, each time it bounced back by rallying by 22% to 83% over the following few days. According to the two charts, it's clear that RSI offers good signals for traders more often than not.
3. Bollinger Bands
Created in the 1980s by John Bollinger, a financial analyst, Bollinger Bands are utilized by traders for technical analysis. They work as an oscillator measurer, indicating whether the market has a high or low volatility or even if there are overbought and oversold conditions.
The main idea behind this Bitcoin indicator is to show how prices are spread across an average value. Bollinger Bands are composed of an upper band, a moving average line, and a lower band. The two outer bands react to market price action. They expand (move away from the middle band) when volatility is high and contract (move closer to the middle band) when volatility is low.
Standard Bollinger Band formulas set the centerline as a 20-day simple moving average (SMA). As for the top and bottom bands, these are calculated based on market volatility.
Middle line: 20-day simple moving average (SMA)
Upper band: 20-day SMA + (20-day standard deviation x2)
Lower band: 20-day SMA – (20-day standard deviation x2)
According to this setting, at least 85% of the price data moves in between the upper and lower bands, but can be adjusted depending on different trading strategies and needs.
Bitcoin Indicators: How to Use Bollinger Bands
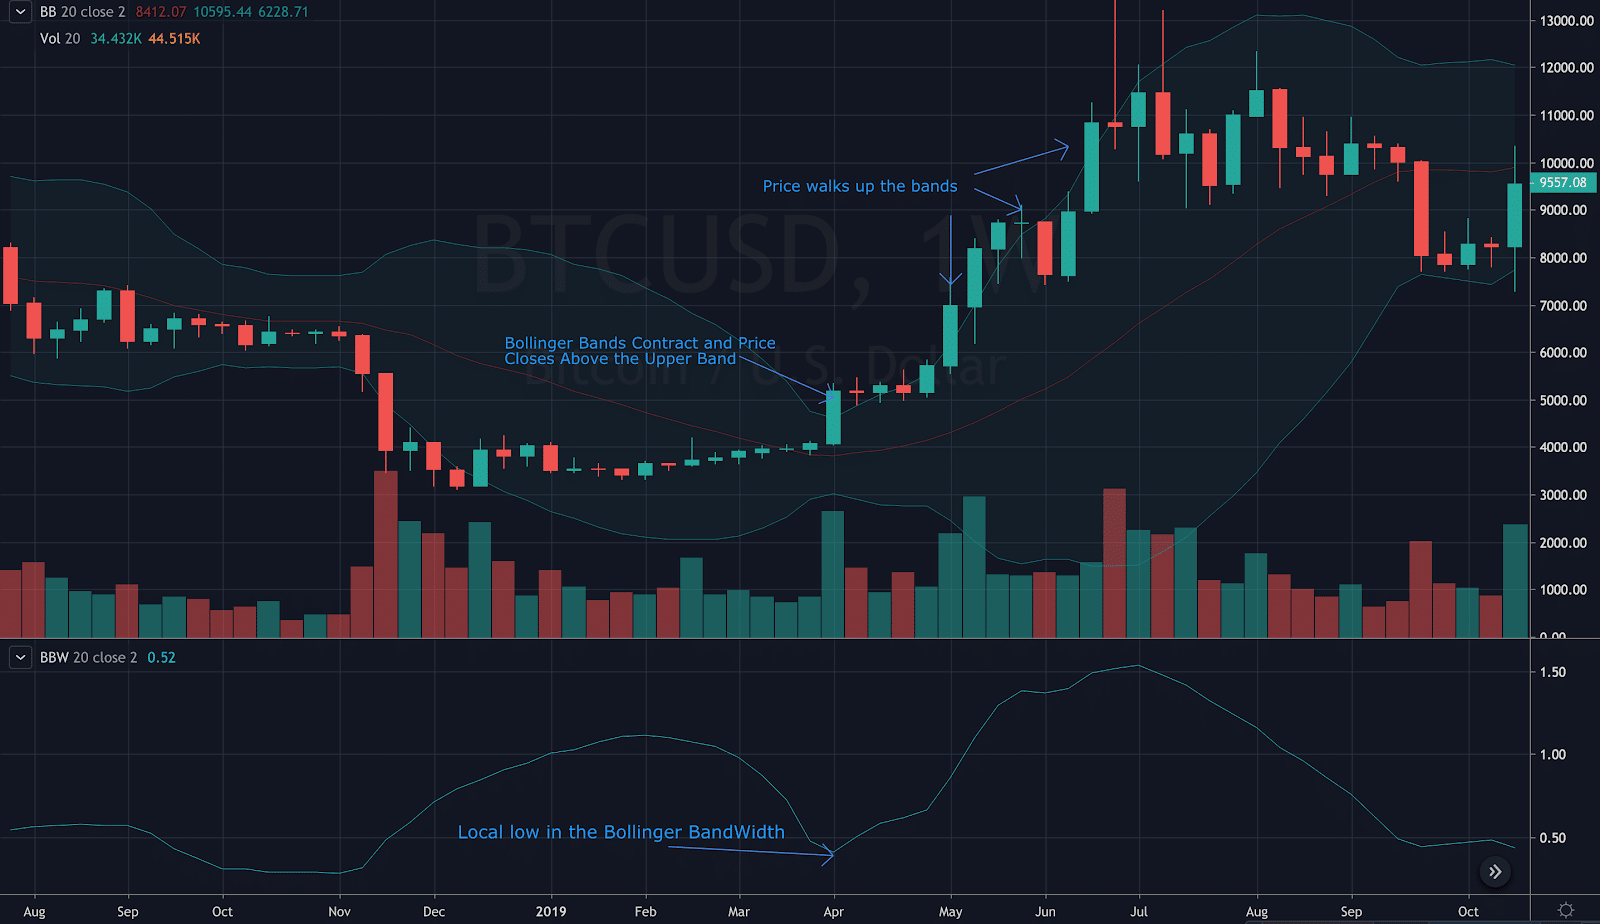
Therefore, if the price of an asset goes past the moving average and exceeds the upper Bollinger Bands, it's safe to say that the market is in an overbought condition (overextended). If the price touches the upper band several times, it could be a sign of a significant resistance level. On the other hand, if the price drops significantly and exceeds or touches the lower band several times, it's an indication of an oversold market, or the price has found a strong support level. Therefore, Bollinger Bands are suitable for short-term trading as you can analyze the market volatility and try to predict the movements that are likely to come.
4. Moving Averages (MA)
Of the Bitcoin indicators, the Moving Average indicator is used to smooth price action over a given period. MA is a lagging indicator meaning that it's based on previous price action. There are two types of Moving Averages; simple moving average and exponential moving average. As a trader, the MA you opt for depends on your trading style. So, if you are a short-term trader, a shorter MA is more effective for your trading style, while a longer MA is suitable for a long-term trader. In trading, MA acts as a support or resistance.
Bitcoin Indicators: How to Use Moving Averages
MA slopes can help a trader define a trend, and doing this is quite simple. Once you find out that the MA is sloping upwards, it means the asset is in an uptrend or gaining in price. But, if the MA is sloping downwards, then this means the asset you are assessing is in a downtrend or losing in price. The chart below shows the slope changing towards the end, which suggests the price entering a downtrend.
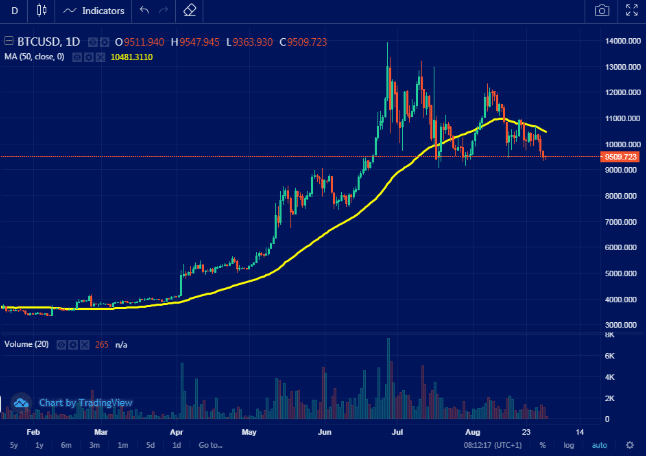
It's important to note that the MA is a lagging indicator. Therefore, a moving average slope can only help you define a trend. Due to this, a single moving average isn’t reliable enough to be used to spot the transition from an uptrend to a downtrend.
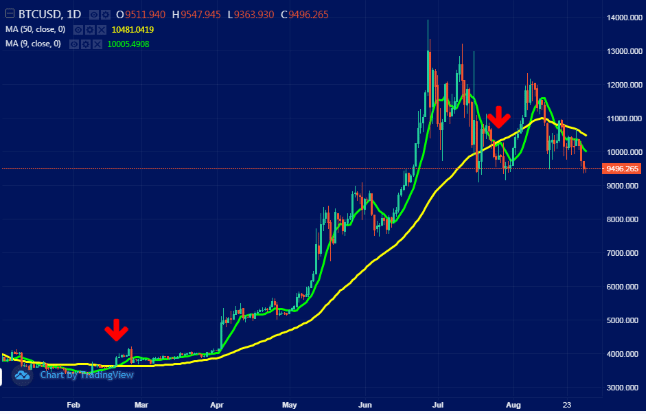
Moving average crossovers offer another popular trading signal. To trade crossovers, you need to have two or more MA’s on your chart. You can use only two crossovers to avoid cluttering your chart and ensure one of the moving averages (MA) is longer than the other.
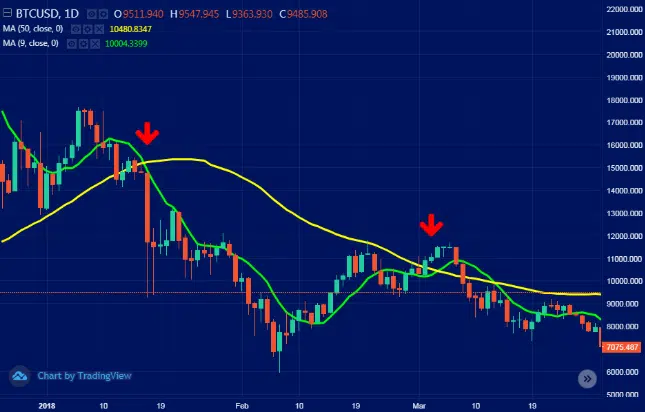
Once you have a short-term MA and a long-term MA switched on your chart, watch out for the crossovers. This is what they mean: If the short MA crosses above the long MA, then this is a bullish trading signal. But, when the short MA falls below the long MA, then this is a bearish trading signal. The chart below shows how BTC triples after the 9 MA goes past the 50 MA on the 1D chart, thereby creating a bullish cross.
See the bearish cross in the chart below and the tremendous price drop that follows.
5. Moving Average Convergence/Divergence (MACD)
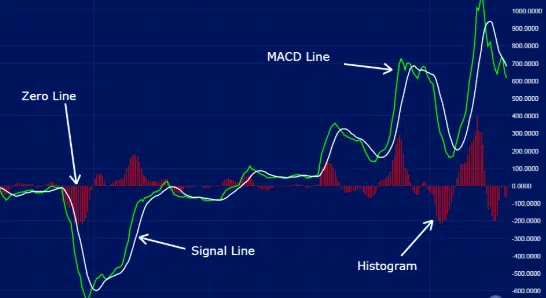
Better known as the moving average convergence/divergence (MACD), this is one of the more popular Bitcoin indicators for cryptocurrency trading. This is due to its simplicity and also the ability to provide strong crypto trading signals. The MACD represents a trend following indicator that highlights whether the short-term price momentum is moving in the same direction as the long-term price momentum, and in cases where it's not, then it's used to determine if a trend change is near. The MACD consists of four components; MACD line, signal line, zero line and histogram.
Bitcoin Indicators: How to Use MACD
To calculate the MACD line, subtract the 26-period Exponential Moving Average (EMA) from the 12-period EMA. EMAs are preferred over regular Moving Averages (MAs) due to their enhanced sensitivity to trend shifts and price momentum.
The signal line, typically a 9-period EMA, is combined with the MACD line to generate trading signals. The convergence, divergence, and crossing of these lines form the basis of many trading strategies.
The zero line represents the level where the MACD line intersects zero. Both the 26-period EMA and the 12-period EMA coincide at this line.
The histogram illustrates the distance between the MACD line and the signal line. It is positive when the MACD line is above the signal line and negative when the signal line is above the MACD line.
Unlike certain Bitcoin indicators, the MACD does not have a defined range, making it unsuitable for assessing overbought and oversold conditions.
Crossovers between the two oscillating lines generate common trading signals using the MACD. A bullish signal occurs when the MACD line crosses above the signal line, while a bearish signal occurs when the signal line crosses above the MACD line. However, it's important to note that these crossovers may produce false positives. Therefore, it is advisable to combine MACD signals with other indicators to enhance trading decisions.
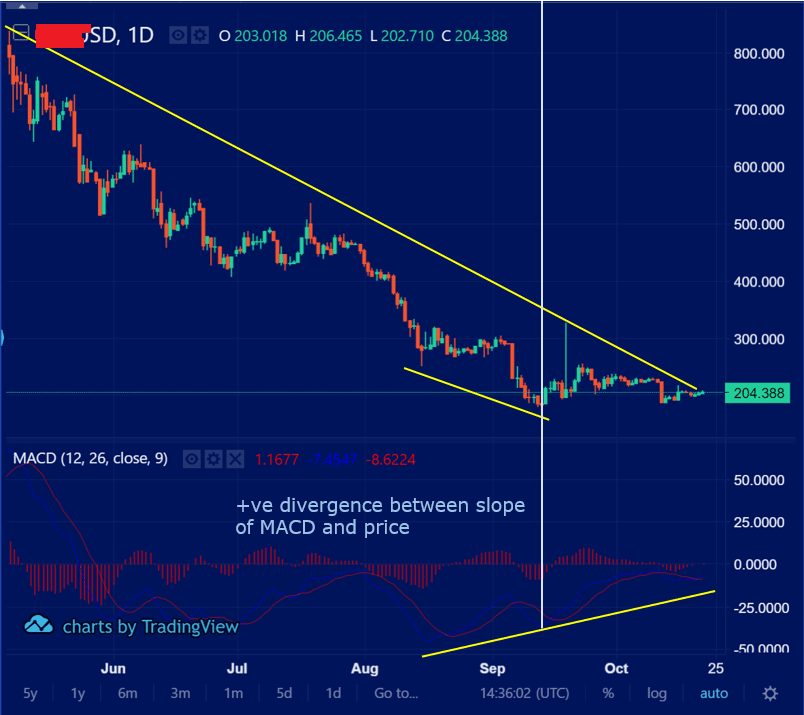
When the MACD line and the signal line rise together, it signifies a bullish sign and indicates increasing positive momentum. Conversely, if the MACD is falling, it suggests a bearish sign and reflects increasing negative momentum.
The MACD can also identify price divergence, which can serve as a trading signal. Bullish divergence occurs when the price records a higher low while the MACD records a lower low, or when the price prints a lower low while the MACD prints a higher low. Conversely, bearish divergence occurs when the price prints a higher high, but the MACD records a lower high, or when the price prints a lower high while the MACD records a higher high. These divergences can indicate an impending trend reversal.
The MACD indicator is a versatile tool that assists Bitcoin traders in assessing momentum, identifying potential trading signals, and recognizing price divergence. By combining the MACD with other indicators, traders can make more informed decisions and improve their overall trading strategies.
6. Fibonacci Retracement
This indicator predicts the potential support and resistance levels for an asset's price action. The word Fibonacci comes from the Fibonacci sequence brought about by Leonardo Pisa, an 11th-century mathematician. The Fibonacci sequence is derived from a sum of the preceding two numbers, with each number roughly 1.618 times greater than the one that came before it. The result is a value known as “phi” or the “golden ratio,” which has a fascinating relationship with almost everything in nature.
This phenomenon extends even to trading when traders analyze price action. This allows one to derive levels in a trend in which the price is likely to respect. This is achieved by dividing the peak to trough distance or trough to peak distance by the phi and other ratios in the sequence. Some other crucial ratios include 0.382 and 0.236. As you gain experience trading, you will realize that price reacts to these levels regularly; thus, it can offer you optimal entry and exit points.
However, before using Bitcoin indicators such as this one to identify potential support or resistance levels, you must be able to locate a “swing high” and “swing low.”
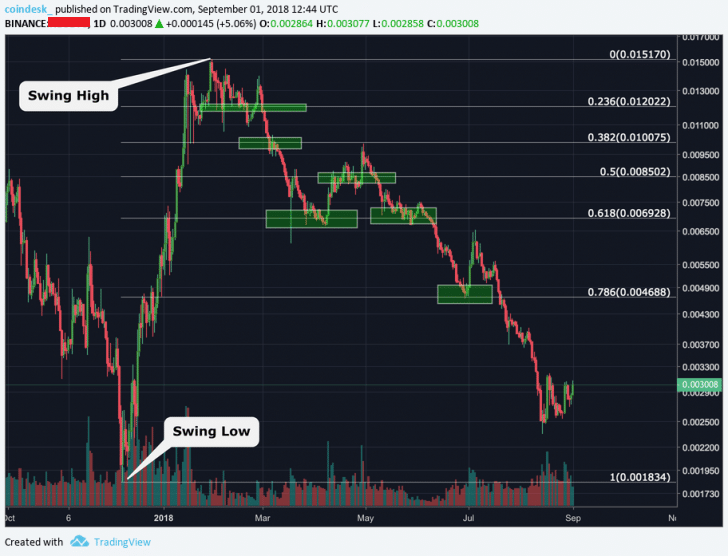
A swing high is a candlestick at the peak of a trend at any given time frame and has a lower high on its sides, whereas a swing low is the low candlestick of a trend that has a higher low on either side. When you identify these points, you can select the Fibonacci retracement tool in your trading software and connect a swing low to swing high.
This way, you will be able to generate potential support levels, also known as retracements. Each support level is derived by dividing the vertical ‘trough to peak' distance by ratios within the Fibonacci sequence.
To find resistance levels, follow the same process but, in this case, connect the swing high to swing low.
7. Stochastic Oscillator
Bitcoin indicators such as the Stochastic Oscillator show momentum by comparing the closing price of Bitcoin with its high-low range over a given period. The good thing is, this indicator works excellently no matter the volatility.
Its formula looks something like this:
Slow %K= 100 [Sum of the (C – L14) for the %K Slowing Period / Sum of the (H14 – L14) for the %K Slowing Period]
Slow %D = SMA of Slow %K
Where C is Latest Close, L14 is Lowest low for the last 14 periods, H14 is highest high for the same 14 periods, and %K Slowing Period is 3.
However, there is no need to panic about the calculation since chart software and trading platforms will process the formula and provide you with a stochastic oscillator, as you will see in the chart below. All that is needed is knowledge of how to use the oscillator to make the most for your efforts.
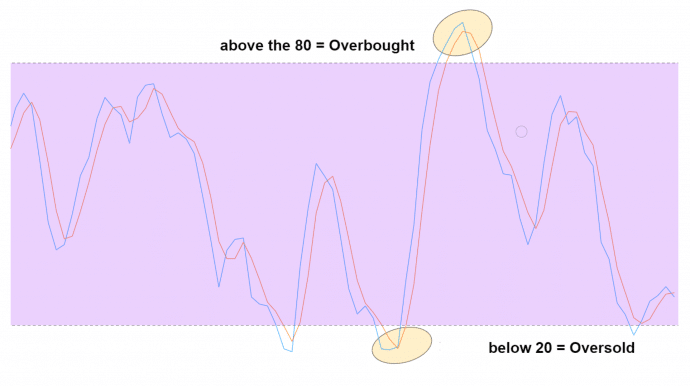
The indicator reads on a range of 0 to 100 with the area above 80, showing overbought conditions and the one below 20 representing oversold conditions. Trend reversal signals appear when the %K line and the %D line cross in the oversold (below 20.00) or overbought (above 80.00) region.
8. Ichimoku Cloud
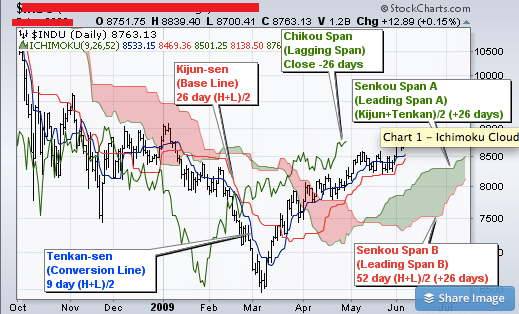
The Ichimoku Cloud indicator consists of five lines, with each line displaying averages over specific periods, with a trader being able to determine how long they need to be. They represent some of the most visual Bitcoin indicators, and this makes them easy to interpret. Also, they clearly define support and resistance, identify trend direction, gauge momentum, and provide several trading signals.
When two lines cross, the area that is between them is shaded in, therefore forming a “cloud.” So, when the price is above the cloud, it means the trend is up, and if the price is below the cloud, then the trend is down. If you find the cloud itself moving in the direction the price is moving; then the trend is quite strong.
Conclusion
There you have it — our ranking of the 8 best bitcoin indicators for trading crypto. As we mentioned above, we highly encourage anyone interested in trading bitcoin to consider signing up to receive free professional trading signals so that you can benefit for all of the experience that the pros have to offer. These indicators are a start, but there is so much more nuance involved in successfully trading crypto.