
Forex Trade Analysis
This article will talk you through everything you need in order to learn how to conduct thorough Forex trade analysis. Consistent success in the forex trading sphere is not very simple as it requires significant prediction and analysis skills. Timely action with prompt and correct decision-making on the part of traders can further elevate the profitability chances.
The foreign exchange market is one of the largest financial markets with trillions of daily trading volume. Traders analyze the market movements and detect the stronger or weaker currency pairs to settle on buying or selling positions.
However, forex trading involves several risks, including leverage employment and unpredictable market movements. According to some estimates, more than 80% or 90% of traders end up losing money in the initial stages of their careers. Therefore, a solid trading strategy and plan are essential to extract consistent gains from this arena.
Here are some of the most popular forex trade analysis methods, their specifications, and how you can review your trades effectively.
Why analyze your forex trades?
Trading without any robust trading strategy and knowledge is similar to gambling and results in massive losses 99% of the time. Only the trading decisions based on solid fundamentals and reason lead to success in the trading domain.
Forex trade analysis involves two primary steps, i.e., evaluation of the price action before placing trades and reviewing the positions after placing trades. Sticking to a developed trading plan can gradually enhance the winning rate over a time period.
On the other hand, emotional trading, employment of excessive leverage, immature understanding of analysis methods, and limited knowledge of market behavior can deliver huge losses and wash out traders' accounts.
What are the major types of forex trade analysis?
The two primary forex trade analysis methods are:
- Technical analysis, and
- Fundamental analysis
Technical analysis focuses on the price charts and statistical trends of securities. Analysts study the historical price patterns and trends to determine the future price trajectory.
On the other hand, fundamental analysis deciphers the intrinsic value of assets by looking at the relevant economic and financial conditions.
How to conduct technical forex trade analysis?
The core concept of technical analysis is to study the past price patterns for deducing future market movement. Technical analysis is a broad term with a subjective concept; hence every trader may come to a unique conclusion due to diverse technical strategies.
You need to effectively utilize and interpret the technical indicators and charting patterns for making knowledgeable trading choices. It is essential to understand the basics of the market and draft a strategy that would suit your trading style.
Moreover, this analysis method is based on the fact that price progress in predictable and repeatable trends. Hence, traders should capitalize on this underlying factor for acquiring stable profits from the forex markets.
Here, we have summarized the basic steps necessary for analyzing your trades.
-
Understand forex charts and time frames
Price movements in financial markets manifest several factors, including supply and demand and human expectations. Forex charts give a graphical presentation of the varying price information in different time frames.
Firstly, you need to decide on a forex graph type you want to work on. There are three main categories, i.e., line graph, bar graph, and candlestick graph. Generally, traders prefer candlestick charts due to their better visual representation and easy-to-read characteristic.
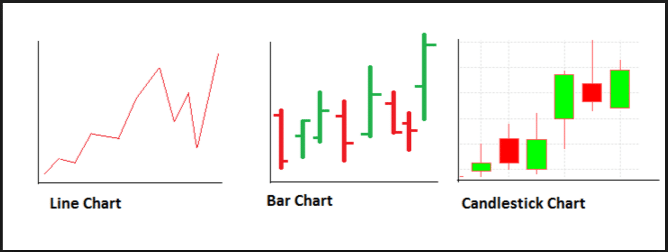
Moreover, diverse timeframes exhibit disparate trading signals and patterns. You need to specify one or two timeframes for trade entries and monitoring. Usually, scalpers and day traders go for 15-min and 1-hour scales; however, swing traders manage their trades according to 4-hour or bigger timeframes.
-
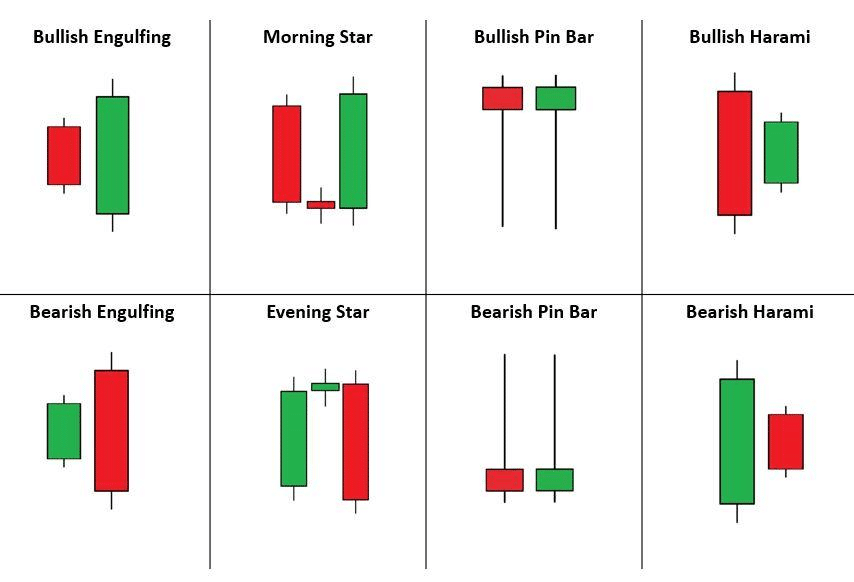
Learn meanings behind candlestick formations
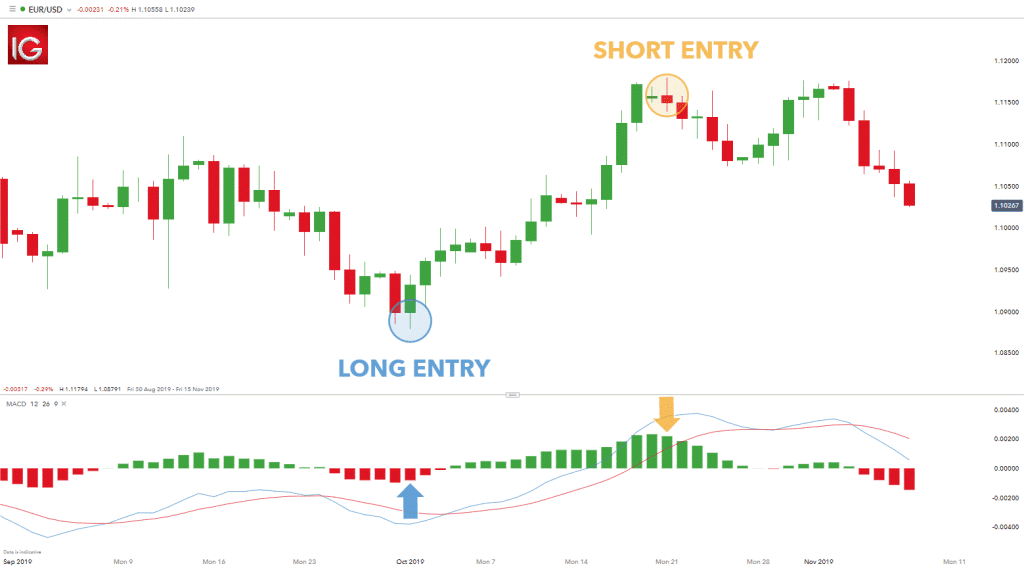
By trading with candlestick charts, you can determine various happenings from the candle opening, closing, position, and formation. Candlestick patterns indicate reversals, the continuance of trends, and indecision of the market.
Studying the shaping of candles can give a considerable idea about the potential next price direction. Some of the most common candle formations are as follows:
- Hammer/ Hanging man (pin bar) candles have a small body on top of a long wick. Hammer is a bullish reversal signal that forms at the end of a downtrend and indicates bullish pressure. In contrast, the hanging man points to a bearish reversal and signifies the end of the previous bullish trend.
- Engulfing patterns involve two candles where a large candle completely engulfs the previous candle and denote the end of the last trend. Bullish engulfing shows that the buyers have taken control of the market, whereas bearish engulfing signals sellers' take over.
- Doji candle forms a sort of cross where there is equal buying and selling pressure. This pattern indicates the market indecision but can provide valuable information in combination with other indicators.
- Morning/ Evening star is a three-candle pattern where a small doji forms between a bullish and bearish candle. A morning star signals a bullish reversal after a strong downtrend, whereas an evening star appears at the top of an uptrend, which symbolizes a reversal.
-
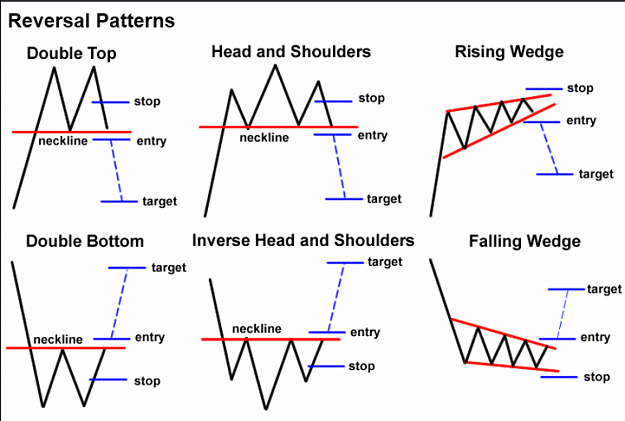
Analyze the chart patterns
Forex charts manifest various price patterns that signify a potential move. As a trader, you need to carefully examine the graphs and enter trades after detecting quality setups. Moreover, it would help lookout for emerging patterns to exit trades and avoid unnecessary losses.
First, identify the current price trend and determine support and resistance levels to detect breakouts and reversals timely. Moreover, analyze the charts in various time frames to discern forming patterns. The most popular chart patterns include Head and Shoulders, Bullish and Bearish Flags, Falling and Rising Wedges, Triple or double bottoms and tops, Butterfly Pattern, and Cup & Handle.
-
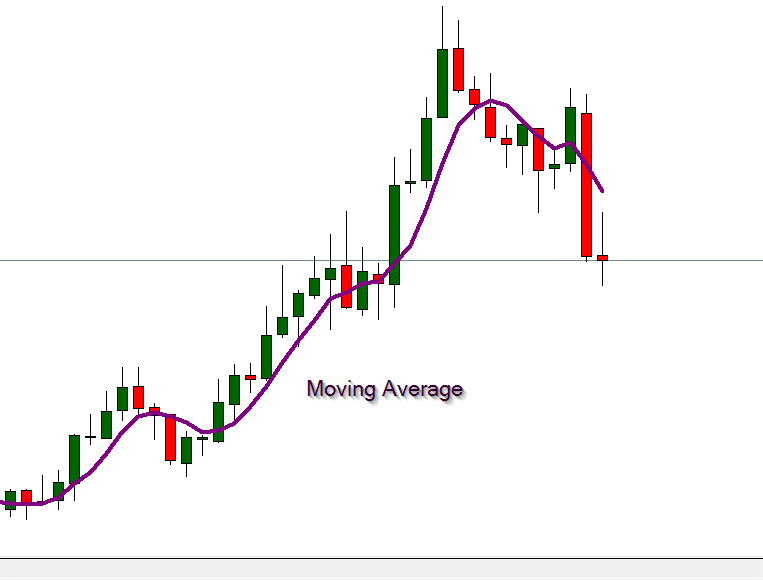
Observe the applied technical indicators
Technical indicators form the core of technical analysis and provide trading signals based on previous price-related data. There are thousands of available indicators that signify unique market information, giving trade opportunities. You should select a mixture of indicators that compliment your trades the best.
The two primary types of technical indicators include oscillators and overlays. Moving averages are the most commonly used indicators that overlay on the price graph and present the average price over a specific period.
Relative Strength Index and momentum indicators come under the category of oscillators that exhibit the market strength instead of direction. Observing these indicators can identify whether a particular market move is insignificant or carry the pressure.
Moreover, other technicals such as Fibonacci retracements indicate pivot points and provide trade opportunities by defining the price rebound area. A careful and correct appraisal of technical signals can boost your winning chances.
-
Develop your trading system
By combining technical indicators and graph patterns, traders can develop unique trading strategies. You can make defined rules for your trading systems and enter the trades when all conditions are fulfilled. Such a disciplined approach can help in enhancing the winning ratio of trades.
For instance, you detect a head and shoulders pattern on the top of an uptrend. You can receive further trade confirmations by the MACD or RSI and check whether they show a solid down momentum. You can also make additional rules after backtesting for chalking out the exact entry point.
Moreover, there are various proven strategies that you can apply and test on demo accounts. Though they are employed with great variations, the basic ones include moving averages cross over, reversal trading, and momentum trading.
-
Set rules for entry and exit points
An orderly and methodical trading approach is the key to success in the trading sphere. Mixing of emotional elements and unbridled trading without stop loss would inevitably lead to huge losses at some point.
You should remain disciplined, and identify suitable stop loss and take profit points for your trades. It is not prudent to lose all your account balance over one trade due to stubborn trading. Remain practical and draft some regulations for exiting and entering the trades.
For example, if you are in a buy position and expect a long trend continuation, you can set a trailing stop loss or exit the trade on the first sign of reversal.
-
Review win/loss rate of trades
Make a trading journal and record your every trade. This method can help you analyze your mistakes and errors as well as your winning points. You can improve your trading only if you track it and evaluate the errors.
Moreover, you could see how you performed during different market conditions and take the lesson to tweak your trading style and strategy.
How to conduct forex fundamental analysis?
Forex fundamental analysis involves analyzing the impact of political, economic, and social factors on currency pairs. This method focuses on understanding the underlying drivers of price action that could affect currencies' strength.
Keeping track of fundamentals can indicate long-term trade opportunities for position and swing traders but carries less importance for day traders. However, news events and announcements such as FOMC or core CPI m/m directly impact the USD prices and render the technicals useless during such instances.
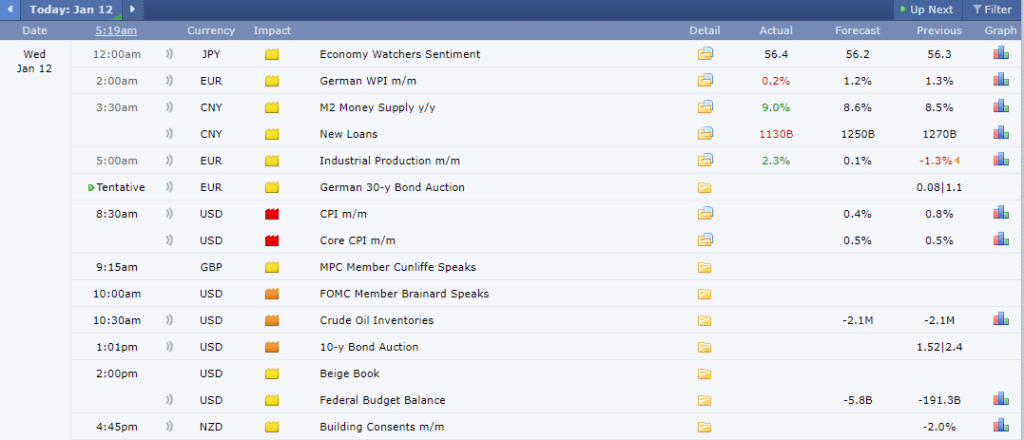
Forex Calendar
You can select a currency and study its macroeconomic and other factors to alleviate your winning chances. Moreover, keep in touch with the financial news and happenings to remain ahead of others.
Tips to improve your trading journal
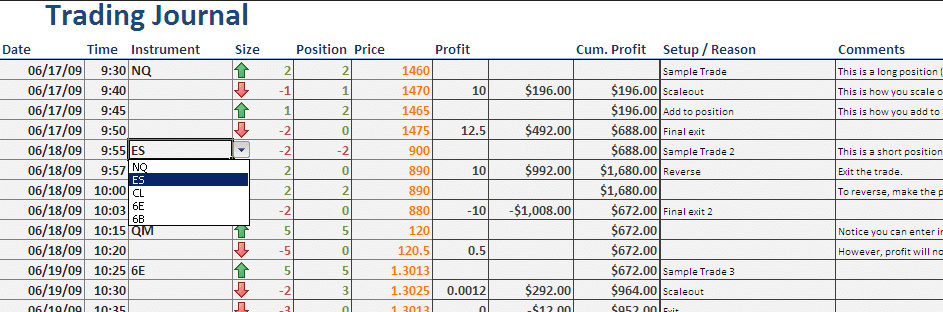
Computerized Trading Journal
A trading journal incorporates all your trading activity records and unveils the repeated mistakes, missed opportunities, wrong decisions, and winning patterns. By improving your trading log, you can consequently improve your trading strategy. Here are some tips to upgrade your trading diary:
- Keeping screenshots or a visual presentation of the traded charts can provide more information regarding the market conditions during which you made previous decisions.
- Mark the entry and exit time of your trading day as it can help you determine the skipped trade opportunities and time durations where maximum trading activity occurs. As a result, you would be able to rearrange your trading timings accordingly.
- If you are a scalper or day trader, don't forget to make a table of winning and losing trades at the end of each day. In addition, you can write short notes with the table specifying the reasons for loss or profit.
- Highlight the winning and losing trades during “news-events” and decide whether you remained profitable in the long run or not.
- Your trading journal is your “own” diary; hence it is essential to remain honest while writing comments about your trades.
- Do not forget to set aside some time for studying these records occasionally; otherwise, the whole task would turn useless.
Final thoughts
Like all the other careers, the only way to excel in forex trading is to keep practicing and learning about it. Gaining significant skills and analytical knowledge to decode forex graphs is essential for remaining profitable in this domain.
Moreover, the key point is to study the past results and modify or redesign your strategies appropriately. In a nutshell, take small and gradual steps for improving your trading skills, as success cannot be achieved overnight.


