
Top Altcoin Trading Indicators
With all the craziness going on in the altcoin markets, it's important to have the best tools at your disposal to spot trends in the market before other traders. Here are our picks for the top altcoin trading indicators.
1. Moving Averages
As a trend-following indicator, moving averages (e.g., SMA or EMA) in the chart indicate the trend direction and also signal the end or reversal of a trend. They also indicate the buy and sell signals through crossovers and are a suitable tool for the trend-following trader (but also for the countertrend trader).
As with any technical indicator, it's important to keep a journal of your success rates, what went well, what's working and what's not.
Simple Moving Average (SMA)
An important benefit of moving averages is their support and resistance function. The crossovers predetermine the trading signals.
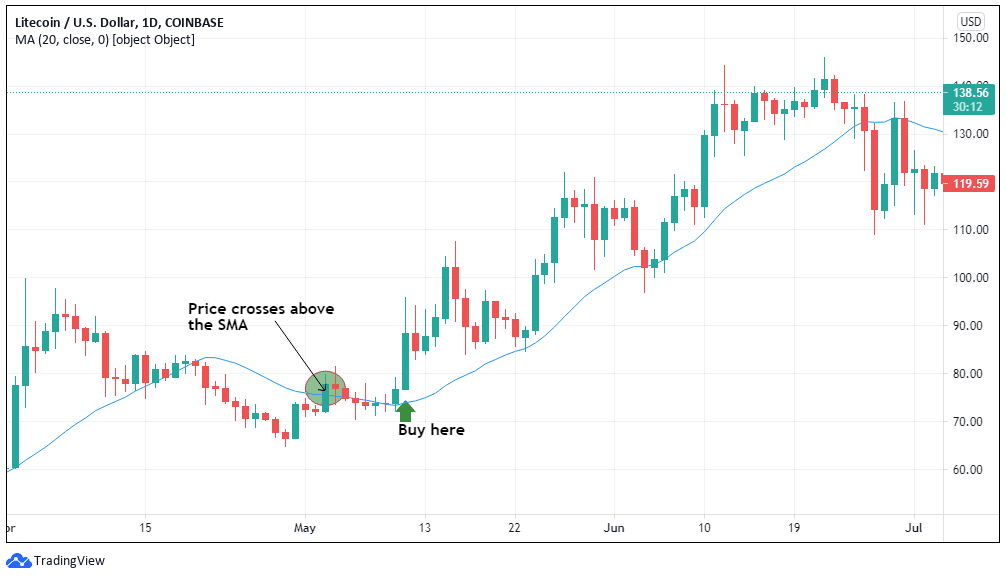
The SMA averages the price over the specified period and plots a smooth line. For example, a 20-period SMA shows the price trend over the past 20 days if you trade using the daily chart.
A buy signal arises when the price rises above the moving average and a sell signal when it falls below it – as simple as that. Since prices tend to pull back to their averages after prolonged trends, makes the SMA an ideal indicator for trading breakouts and reversals.
In a bullish trend, the SMA is rising – the steeper it is, the stronger the bullish trend. In this case, the average price for the past 20 periods is rising. When the price trends above the SMA, it means the current price is rising faster than the average of the previous 20 periods. The current market is bullish.
As a rule, always wait for the price to pull back and bounce off the SMA to get the confirmation to go long. This serves to confirm the bullish trend.
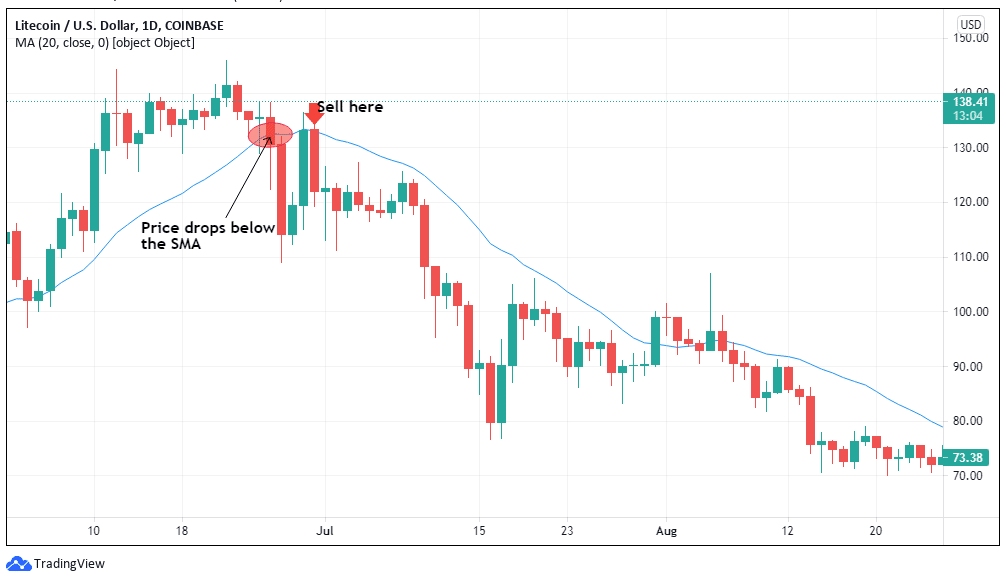
The sell signal is generated when the price crosses below the SMA. That means that traders are currently more bearish than over the past 20 periods. However, it would be best if you waited for the price pullback and subsequent bounce from the SMA to short the market.
Exponential Moving Average (EMA)
The best way to trade with moving averages is with two EMAs.
Unlike the SMA, the EMA assigns more weight to the most recent price fluctuations. This means that it is more sensitive to price changes than the SMA and can quickly capture changes in the trends. The double EMA altcoin trading strategy uses a higher period EMA and a lower period EMA. In this example, we will use the 50-period EMA and 20-period EMA. You can adjust the periods depending on your trading style.
The rationale behind this strategy is that the 20-period EMA will be highly responsive to changes in the price than the 50-period EMA.
When both EMAs trend in the same direction, it means that the most recent and past price changes are trending in the same direction. For example, if you're trading the 1-hour chart, and both EMAs are bullish, it means that traders have been bullish for the past 50 hours and 20 hours. Note that the momentum is stronger when the EMAs are steeper.
Identifying Buy Signals with EMA crossover
The ideal trading strategy using the EMA crossover is in a trending market. i.e., when there is an established bullish or bearish trend. If you'd like some help identifying these trends from a team of hardened professionals, spend a little time in a free telegram signals group.
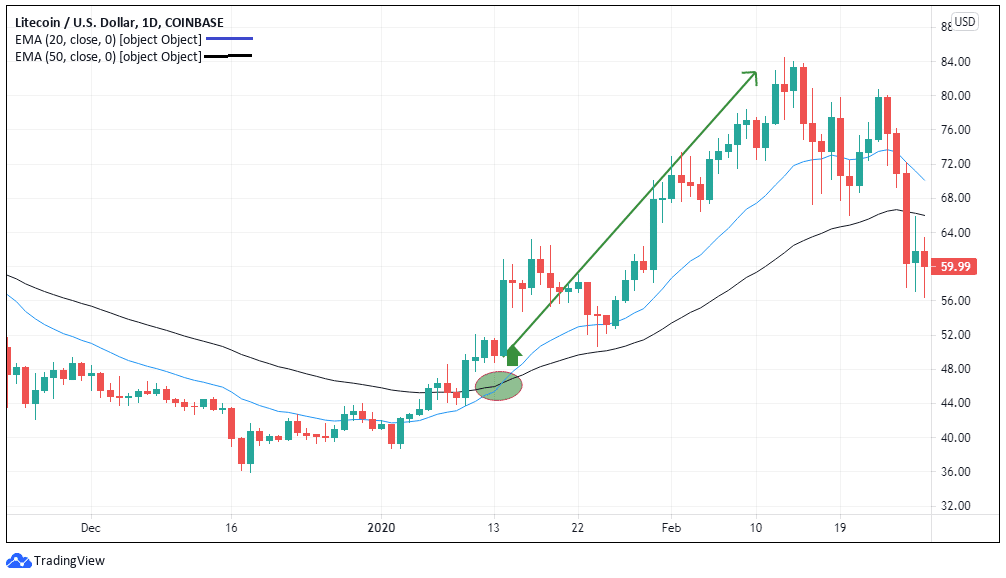
A buy signal occurs when the 20-period EMA crosses and trends above the 50-period EMA. When the lower period EMA crosses above, the higher period EMA means that the most recent market trend is rising faster.
However, EMAs are often prone to fake-outs. To avoid this, always wait for a clear bullish trend to be established before going long. Always wait for the 20-period EMA to close above the 50-period EMA, with a bullish candle above both EMAs.
Identifying Sell Signals with EMA crossover
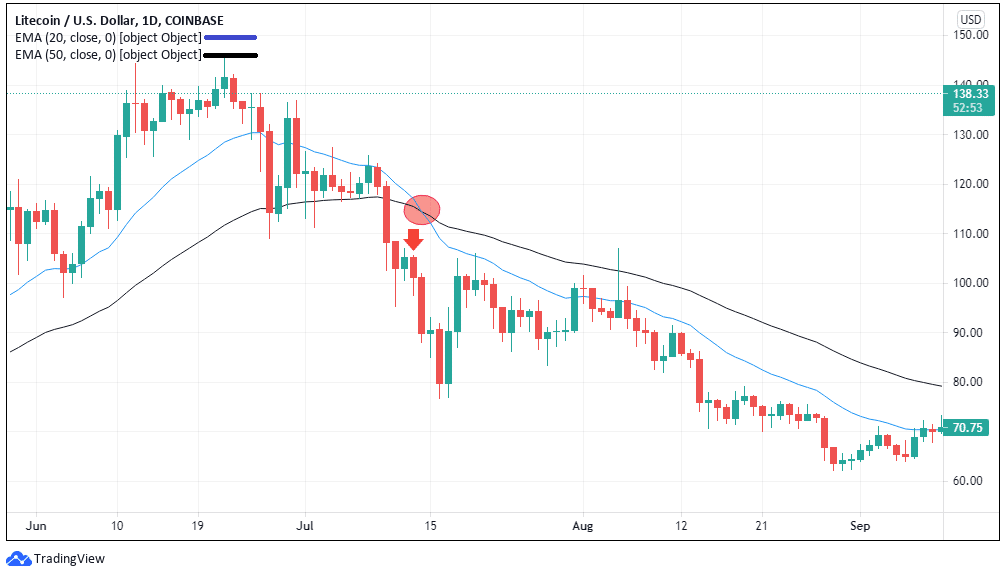
The sell signal occurs when the lower period EMA crosses and trends below the higher period EMA. This means that the most recent price is dropping faster hence a high-momentum bear market. However, only short the market when 20-period EMA closes below the 50-period EMA, with a bearish candle below both EMAs.
2. Commodity Channel Index (CCI)
The CCI is a technical indicator that shows both market trends and their magnitude (strength). David Lambert developed it in the early 1980s specifically for the commodities market. But thanks to its prowess, it has been adapted for altcoin trading. There are very few successful technical indicators that accurately show the market trend and its strength. That is where the CCI indicator thrives.
The CCI comprises an upper and lower bound with an oscillator fluctuating between +100 and -100 (the upper and lower bounds). Due to its reliability and expressiveness in trend phases, the CCI is one of the much-used indicators for day trading. Let's break down how you can use this versatile trading indicator.
How to Identify the Overbought and Oversold
The Commodity Channel Index measures the distance between prices and the moving average. As a result, trends and trend strength are determined. Values between 100 and -100 are “market noise” – they point to rather trendless markets. Only the values outside this range are consequential for traders.
A value above +100 is overbought, while a value below -100 is considered oversold.
CCI Indicator Buy Signal
When the CCI crosses above the +100 bound, the asset is considered bullish. This is a buy signal.
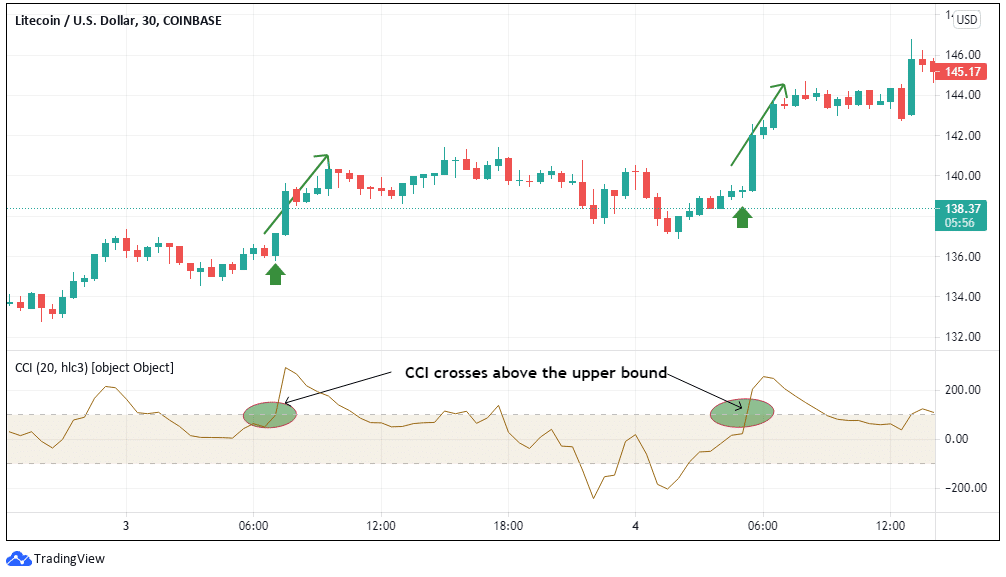
Exit the long position when the CCI crosses below the upper bound. It shows the bullish trend is weakening and reversing into a bearish one.
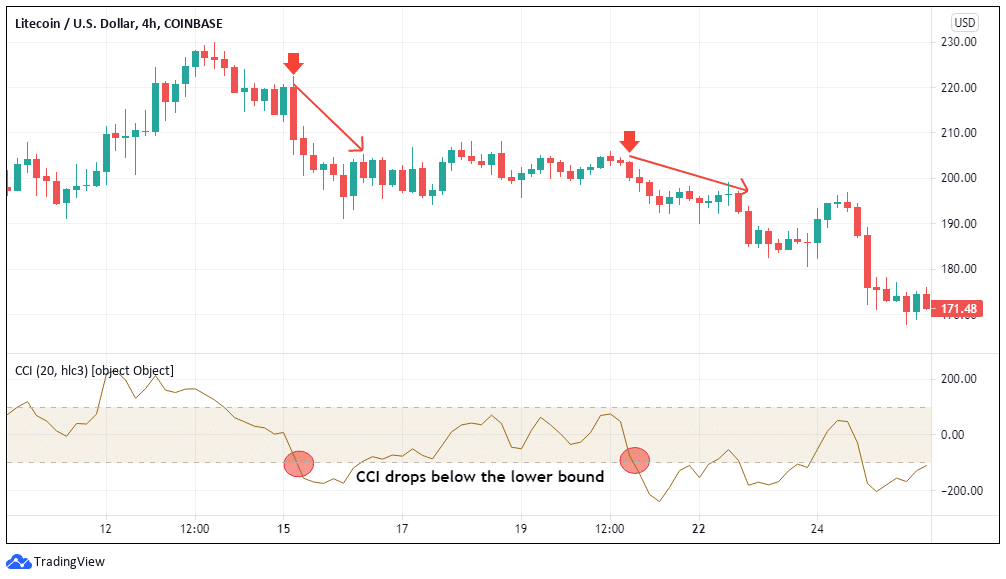
CCI Indicator Sell Signal
When the CCI line crosses below the -100-lower bound, it means that the currency pair is bearish. This is the ideal time to short the market.
Exit the short position when the CCI crosses above the lower bound. It shows that the bearish trend is weakening and possibly reversing into a bullish one.
Trend Reversals
The CCI also shows deviations that lead to trend reversals.
A bullish deviation occurs when the CCI is in oversold territory, and the CCI creates higher lows and price lower lows. This price action could indicate a trend reversal and provide traders with additional confirmation points for market entry.
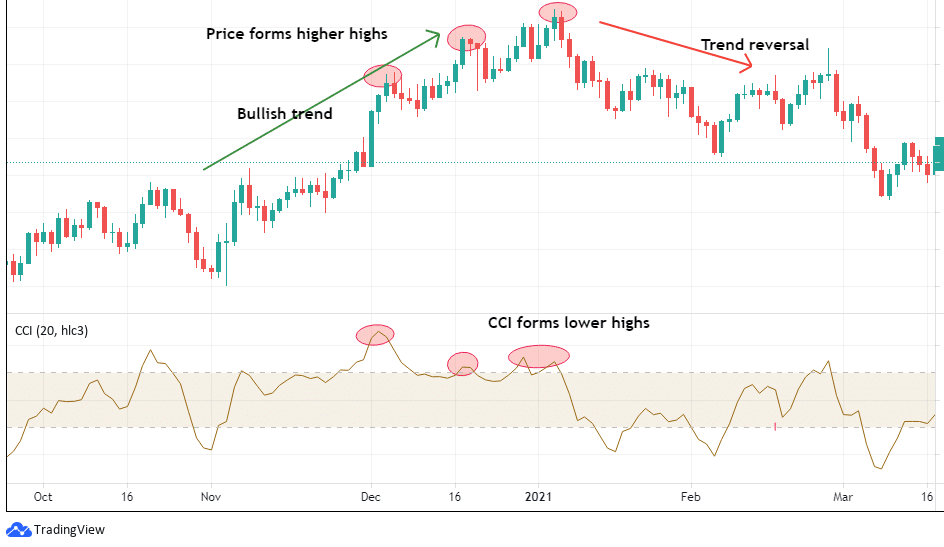
Conversely, a bearish divergence occurs when the price is forming lower lows while the CCI forms higher lows.
Although the CCI is one of the most versatile technical trading indicators, it isn't foolproof. Theoretically, any selected asset can move down or up without limits. Thus, even if the CCI is at extreme levels, the price can always rise higher and higher. Similarly, the price can continue to move downwards, even if the CCI is below the value of -100. This indicator can provide more accurate signals when the trader incorporates price action analysis and use it together with a volatility indicator, such as the Bollinger Bands.
3. The Stochastic Oscillator
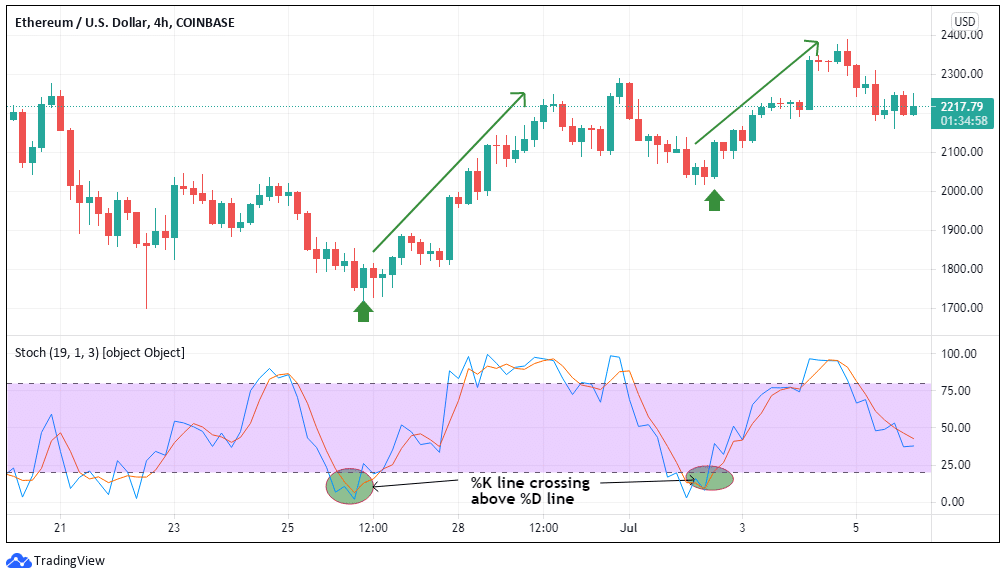
This is a momentum indicator that shows when an altcoin is at the overbought or the oversold territory by comparing the price changes over a specified period. The indicator has an upper and lower bound. It consists of the faster %K line (blue) and the slower %D line (red), which oscillate in a range from 0 to 100.
Overbought Territory
An altcoin is overbought when the oscillator goes beyond the upper bound.
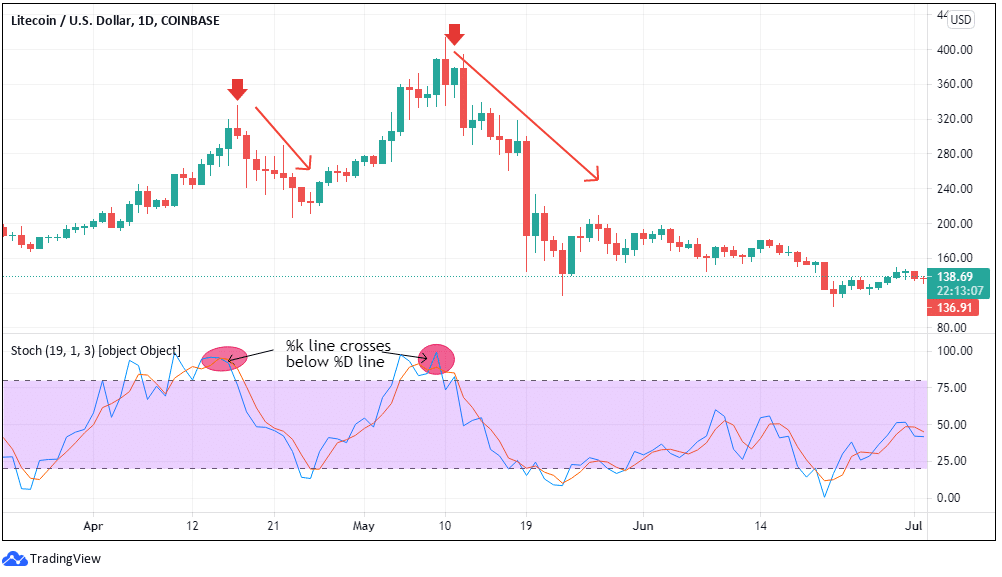
Typically, the overbought territory occurs when the indicator rises above the upper bound. This is a direct result of buying pressure which pushes the prices higher. When the market enters the overbought territory, we expect that traders with long positions will exit them since the uptrend momentum is bound to wane.
That means that the market will have net sellers. A sell signal is generated when the oscillator drops from the overbought region and the %K line crosses below the %D line. Here, short-sellers are driving the prices down, signaling the start of a bearish trend.
Oversold Territory
An altcoin is oversold when the oscillator drops below the lower bound.
This results from the selling pressure in the market, which pushes the prices to lower lows. However, when the prices reach the oversold region, we can expect that sellers will embark on profit-taking. That means there will be net buyers in the market. Consequently, the bearish trend weakens and reverses into an uptrend.
A buy signal is generated when the oscillator rises from the oversold region, and the %K line crosses above the %D line. It means there is increasing buying pressure in the market, signaling the beginning of an imminent bullish trend.
Identifying divergence using the Stochastic Oscillator
Divergence happens when the stochastic oscillator does not reflect the highs and lows reached by the altcoin's price.
A bearish divergence occurs when the altcoin registers new higher highs while the stochastic oscillator only shows lower highs. Since this is a momentum indicator, its failure to register higher highs, as seen in the price action, is a sign of a weakening uptrend. Thus, we can expect a trend reversal.
Similarly, a bullish divergence occurs when the altcoin registers new lower lows in a downtrend, and the oscillator has higher lows. This shows that the bearish trend is losing its momentum, and we can thus expect a reversal into an uptrend.
Although the stochastic divergence shows imminent trend reversals, it is recommended to use other technical indicators to confirm entry positions. The reason for this is because the price may continue in the current trend before a reversal.
4. The Relative Strength Index (RSI) Indicator
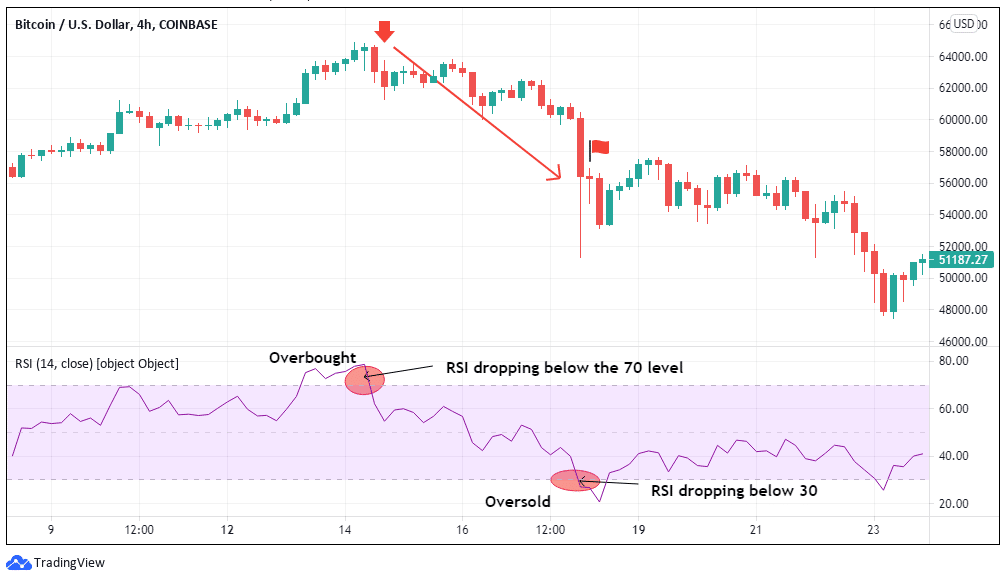
The RSI line oscillates between 0 and 100. If the line leaves the extreme range above 70, this is considered an overbought market and thus a sell signal. If the price movement takes place in the extreme zone below 30, there is an oversold market and can be interpreted as a buy signal.
There are different ways of interpreting the RSI, but the consensus is that when the RSI trends above 70, the market is overbought and below 30, the market is oversold.
In the overbought region, traders in long positions exit them, which significantly reduces the bullish momentum. However, the sell signal is only generated when the RSI drops below the upper bound from the overbought region. It shows that sellers exert a significant downward push on the prices to turn the market bearish. Exit the short positions when the RSI drops below the 30 level. At this point, the market is entering the oversold territory, and a trend reversal is imminent.
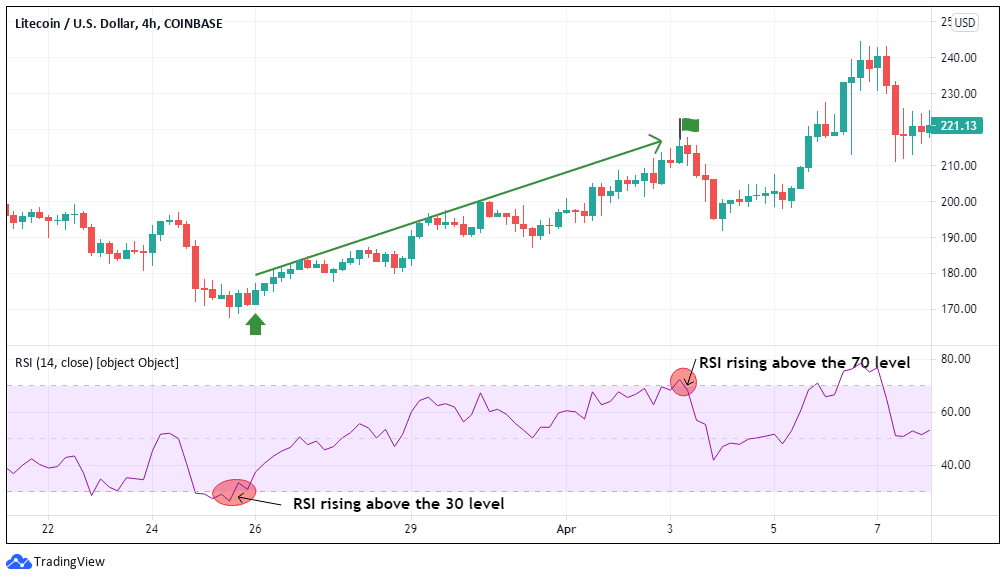
The oversold territory develops when the RSI drops below the 30 level. The bearish trend weakens as sellers exit the market.
The buy signal is generated when RSI rises above the 30 level from the oversold territory. This shows the beginning of an uptrend as buyers dominate the market. If you go long here, exit the long positions when the RSI rises above the 70 level when the market is entering the overbought territory.
RSI Divergence
The RSI provides good information about whether a market is overbought or oversold. It measures the momentum of market movements over a selected period. If, for example, the price of an altcoin rises and the RSI declines, then this can be a clear indication of an imminent bearish trend.
Divergences between price action and RSI can be used to identify upcoming trend reversals. They are present when prices reach new highs, but the RSI generates lower highs and vice versa when prices fall to new lows, but the RSI reaches higher lows. If the RSI then reaches the opposite extreme range, the trend change is considered confirmed.
When the price forms higher highs while the RSI forms lower highs, it implies that the price is still rising, but the momentum is waning. It's a strong sign of an upcoming bearish trend.
Conversely, when the price forms lower lows while the RSI forms higher lows, it signals a possible bullish reversal.
However, keep in mind that divergence does not necessarily have to be followed by a trend reversal. There may be a longer period between divergence and the time when the course of the price changes direction.
Bottom Line
We have covered the top four trading indicators for altcoins. However, although these indicators are consistent in showing the trend and momentum of the price action, they shouldn't be used alone. You might consider combining your own technical analysis with that of a team of professional traders to make your trades more consistent and avoid big losses.


