
How to Read Candlestick Charts for Cryptocurrencies
Introduction
Candlesticks are by far the most popular charting tools in trading. That's because they are versatile and offer a lot of information regarding the crypto price, and candlestick price charts can also be used for technical analysis. You can combine your own analysis with signals from professional traders to make your gains more consistent.
Anatomy of a Candlestick
With candlesticks, you get an instant snapshot of the market across any timeframe. This comes in handy if you want to establish whether the market is bullish, bearish, or neutral. During large market swings, the charts can get hairy and you'll need to manage your risk carefully. Depending on the trading platform you use, you can view the market trend on timeframes ranging from 1 second to 1 year.
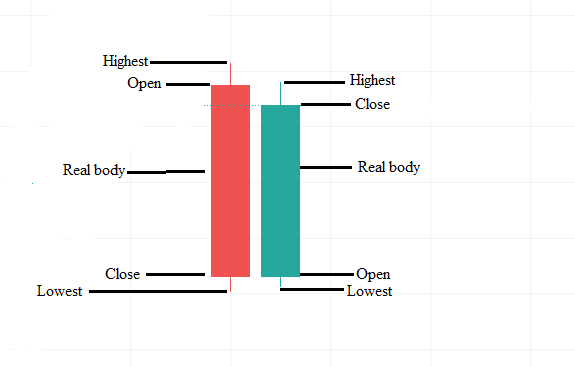
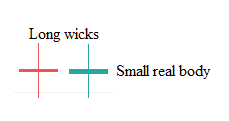
Typically, a candle consists of a body and wicks. The body shows the opening and closing price of the crypto, while the wicks show the highest and the lowest price the crypto reached during that timeframe. The wicks are the thin lines extending on either side of the candle's body; they are also called shadows.
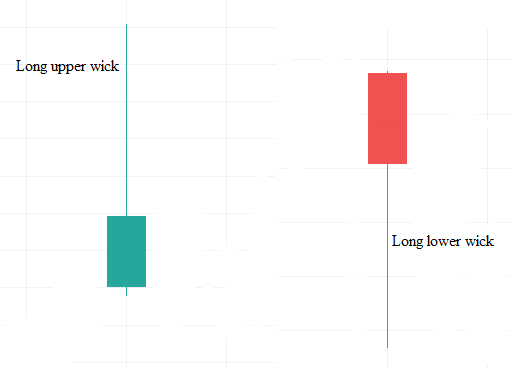
Typically, when a candle has a long upper wick, it could indicate an impending bearish trend. It shows that sellers are dominating the market – most probably because traders are taking profits.
Similarly, a candle with a long lower wick could be a bullish signal. It shows that buyers are dominating the market, pushing the prices higher.
On most trading platforms, a green candle is a bullish candle – it means that during that particular timeframe, the price closed higher than when it opened. Conversely, a red candle is a bearish candle – meaning that the price closed lower than the open. Note that you can customise these colours.
Multiple Timeframe Analysis using Candlesticks
Candlesticks can be used for technical analysis by comparing crypto price trends across different timeframes. This is called multiple timeframe analysis. This technique allows you to establish the trend buildup progressively from a short timeframe to a larger one or break a longer-term trend into shorter timeframes.
For example, a 1-minute candlestick shows the price fluctuation during that minute. It shows the opening price, the highest and lowest price attained, and the closing price for that period. The same applies to every other timeframe.
You can also view it this way; a 5-minute price chart is a combination of five 1-minute timeframes since it shows the price fluctuation for 5 minutes. Similarly, a 1-hour timeframe is a combination of 60 1-minute timeframes. In this case, the opening price of the 1-hour timeframe is the same as the opening price for the first 1-minute candle. Similarly, the closing price for the 1-hour timeframe is equal to the closing price of the 60th 1-minute candle.
You can use this logic to break down any timeframe into smaller timeframes or build a larger timeframe from a series of smaller timeframes.
Types of Candlestick Chart Patterns
Candlestick chart patterns can be categorised into three broader categories, depending on the number of candles included in forming the pattern. They are:
- Single candlestick chart patterns
- Dual candlestick chart patterns
- Triple candlestick chart patterns
Single Candlestick Chart Patterns
The Marubozu Candlestick Pattern
The Marubozu pattern includes no upper and lower shadow. This candlestick pattern has just one candle with no wicks – it only has a body.
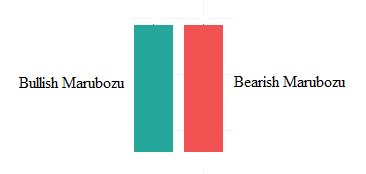
The Marubozu pattern can either be bullish and bearish, depending on the dominant trend in the market. In an uptrend, this pattern indicates that buyers are still dominant in the market and that the uptrend is likely to continue. The bullish Marubozu is green, meaning that the price increased steadily with no fluctuations or volatility during that period.
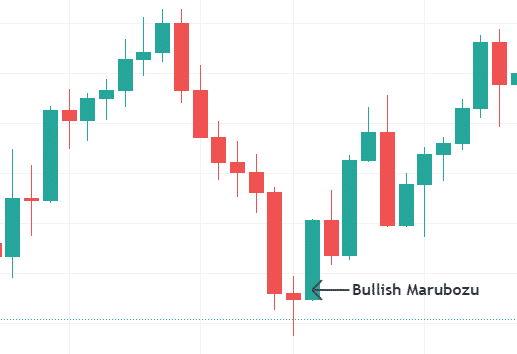
A bearish Marubozu pattern appears in a downtrend – implying that sellers are still dominant in the market. The bearish Marubozu has no wicks meaning that the price dropped steadily during that period with no volatility. This implies that the downtrend is likely to persist. Here's how the Marubozu candlestick pattern looks like on a price chart:
The Spinning Top Candlestick Pattern
Depending on the prevailing market trend, the spinning top candlestick pattern can indicate either a trend continuation or a trend reversal. It has a small candle body with long wicks. The upper and lower wicks may be the same size.
This pattern means that neither the buyers nor the sellers dominated the market during that period. There are two possibilities when this pattern appears
- The market could potentially reverse in either direction, or
- There will be a continuation of the current trend
When the spinning top candlestick chart pattern appears, it is recommended to use technical momentum indicators to identify the likelihood of the subsequent trend.
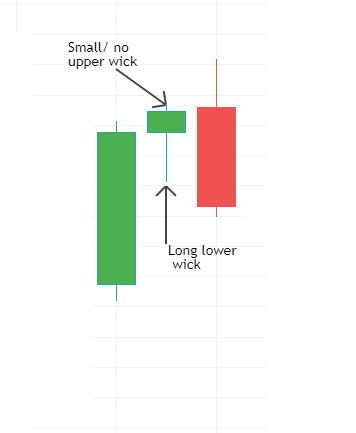
The Hanging Man Candlestick pattern
This pattern is a single pattern of the candlestick pattern that forms during an uptrend and precedes a downtrend. The pattern is characterised by a small candle body, no upper wick and a long lower wick.
It's a reversal pattern, which implies that the current trend is about to change into the opposite one. For example, it f appears in a bullish trend; it means that the trend is about to turn bearish. In this case, it shows that sellers are dominating the buyers in the market.
In a downtrend, the hanging man candlestick pattern's appearance shows that the market is about to turn bullish. This indicates that the short-selling pressure is getting exhausted, and buyers are about to push prices further higher.
The appearance of a hanging man pattern can be used as a signal to exit a trade. If you are in a long trade, you should exit your trade when the hanging man candlestick pattern forms since the pattern precedes a bearish trend.
Similarly, if you are short in the market, close your position when this pattern forms since it implies that the market is about to turn bullish.
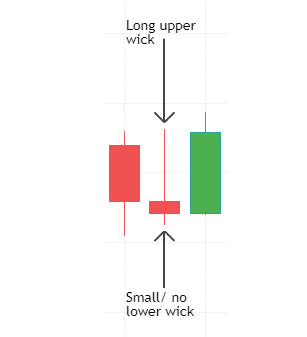
The Shooting Star Candlestick Pattern
This candlestick pattern shows potential market reversal. It has a small body with a very short lower wick and a longer upper wick.
In an uptrend, this pattern forms when the momentum of the uptrend is waning. Typically, the shooting star candlestick pattern can be used as a resistance level. This means that, at this point, the buyers could not push an asset's price much higher since sellers flocked the market, pushing prices down.
This pattern should come after a sustained uptrend in the market. It is recommended to wait and observe if a trend reversal begins to form after the shooting star appears. If a downtrend starts to form, it should confirm that a bearish trend will ensue.
Dual Candlestick Chart Patterns
Tweezer Tops and Bottoms Candlestick Charts
This double candlestick pattern signifies trend continuation. The tweezer top is formed when the highs of two candlesticks occur at the same price level following a bullish candle. Tweezer bottoms form when the lows of two candles occur at the same price level, following a bearish trend.
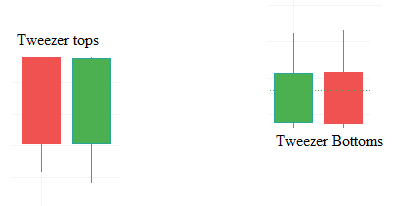 In this pattern, the first of the two candles show the direction of the short term trend, while the second candle is seen as a pause to this trend, or possibly the start of its reversal. This shows that there has been a shift in the short term momentum, suggesting that the price is likely to continue with the longer-term trend.
The difference between the open and close should be large for the first candle, i.e., it should have a real body. The size of the second candle can vary. However, if it is larger than the first candle, it means that the price can continue trending
This is a dual candlestick pattern that indicates the continuation of a trend.
A bullish Harami shows that the short-term bearish trend is weakening, and the market is likely to continue with the longer-term bullish trend. This pattern is characterised by a long candlestick followed by a relatively smaller body within the previous body's vertical range.
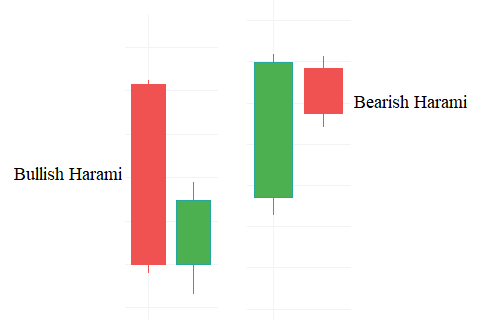
Below is a chart showing how a bullish Harami forms on a price chart. Notice that the preceding short-term trend is a bearish one; the small green candles show the short-term trend's reversal into an uptrend.
In the short term, there has to be a clear pattern that shows a bear market. The second candle in this pattern has to close near the middle of the previous candle. This shows that there is a higher likelihood that the price will reverse into an uptrend.
The Harami candlestick pattern should be used alongside single candlestick patterns to ensure the accuracy of the entry signals.
In this example, we have shown the bullish Harami. The bearish Harami forms in the exact opposite way.
Engulfing Candlestick Pattern
Engulfing is a two-candle trend reversal pattern, which derives its name from the fact that the second candle in the pattern completely overshadows the first candle.
A bullish engulfing candlestick pattern forms when in a downtrend, a bearish candle (red) 3precedes a larger bullish candle (green), which completely engulfs it.
A bearish engulfing candlestick pattern forms when a green candle in an uptrend is followed by a long bearish candle that completely engulfs it.
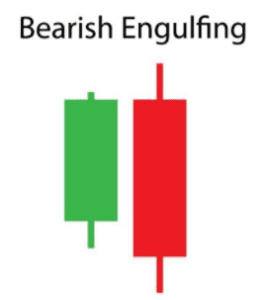
Typically, the second candle's body should be considerably larger than the first candle in the pattern. The best case for a reversal occurs if the engulfing candle is larger than at least three other candles preceding the pattern.
Chances of a reversal are higher if the engulfing candle has no upper wick for a bullish reversal and no lower wick for a bearish reversal. This implies that the price has been progressive with no volatility
Dark Cloud Cover Candlestick pattern
The Dark Cloud Cover pattern is a bearish reversal candlestick pattern formed by two candles.
Here, the bearish candle (red) opens above the first candle in the pattern and closes around the midpoint of the first candle. Note that the first candle in this pattern has to be a bullish candle towards the end of an uptrend.
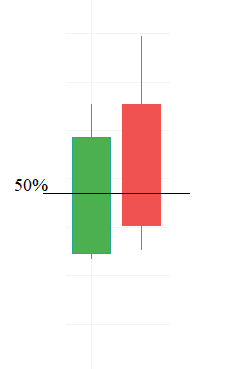 The pattern shows buyers are struggling to push prices further higher, but sellers significantly gained control of the market, pushing prices down.
For the Dark Cloud Cover to be accurate, there must be a well-established uptrend on the candlestick chart. There should be a gap between the closing of the first candle and the opening of the second candle in the pattern, and the second candle should close at least around the midpoint of the first candle.
Typically, traders should wait for the confirmation of a trend reversal before making any short trades. The confirmation is often the formation of another bearish candle that closes below the second candles of the pattern.
Triple Candlestick Chart Patterns
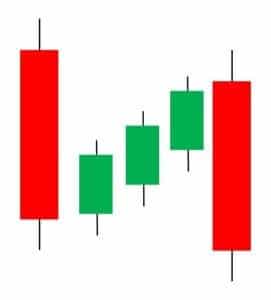
Three White Soldiers Candlestick Pattern
This is a triple candlestick pattern and is classified as a continuation pattern. The appearance of the Three White Soldiers candlestick pattern signifies the reversal of a short-term downtrend into a long terms bullish trend – this is why it's a continuation pattern.
The pattern is characterised by three long-bodied candles that open within the previous candle's body and close above the previous candle's high.
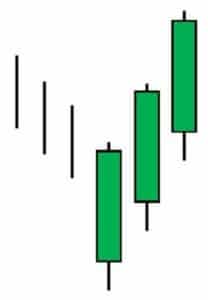 Due to its versatility, the Three White Soldiers pattern can be used to enter and exit a trade. For example, traders with short positions will exit the market when this pattern forms, and it can be used to open a long trade since a bullish trend follows it.
Falling Three Methods
The Falling Three Methods candlestick pattern is a trend continuation pattern. Although it may look like a reversal, Falling Three Methods is a continuation pattern.
 This candlestick pattern is a bearish continuation pattern with two long bearish candles on either side of the Falling Three Methods – which are bullish candles. The series of small-bodied candles should be of the same colour. However, a bearish Doji as the third candle can also be considered.
Traders use this pattern to open new short positions or add on to existing short positions. Although this is a three-candlestick pattern, the fifth candlestick is the confirmation candlestick, indicating that the bearish trend will continue. Technical indicators can also be used to confirm entry positions.
If all these patterns are a bit overwhelming, why not just leave it to the experts?
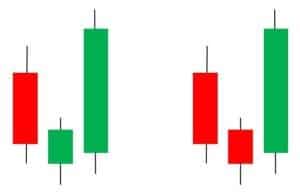
Morning Star Candlestick Pattern
This is a three-candlestick pattern that signals the reversal of a trend. The pattern often occurs towards the end of a downtrend and signals a reversal into a bullish trend.
 However, before buying into the market, traders often use momentum indicators to confirm that the downtrend is coming to an end.
- The first candle in this pattern is a long bearish candle with very small or no wicks.
- The second candle is often a small bearish or bullish candle. This signifies indecision in the market as buyers and sellers try to gain control of the market.
- The third candle is a long bullish candle that confirms the reversal and marks a new uptrend.
Three Inside Up Candlestick Pattern
This is a three-candlestick pattern that indicates a reversal of a trend when they appear on a price chart. The pattern shows that the current trend is losing momentum and is bound to reverse.
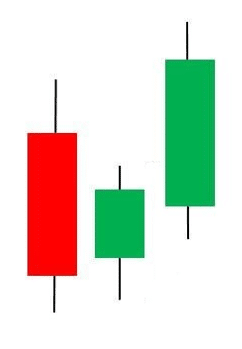 This pattern occurs when the market has a clear downtrend. The first candle in the pattern should be a long bearish candle, while the second candle should open and close within the body of the first bearish candle. Note that the second candle must be bullish. This shows that buyers are returning to the market.
The third candle should be a long bullish candle that closes above the first candle of the pattern.
Bottom Line
If you want to get more consistent in your trading, one of the most important areas of study is that of candlestick charts. There are of course other things you can do to boost your trading ability, like keeping a journal. You can also get market analysis and insights from professional traders.


